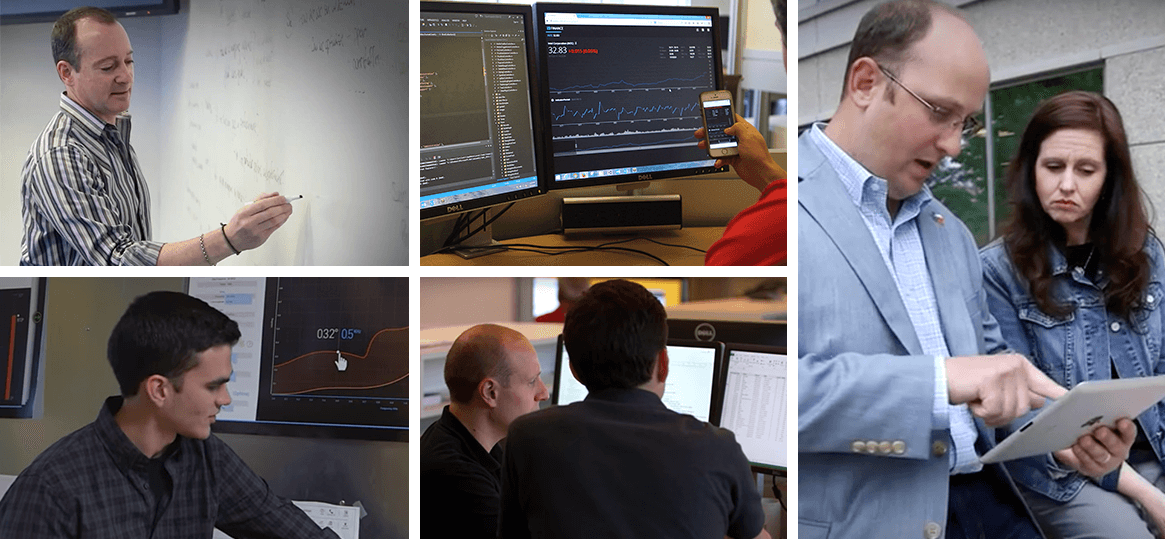
Our Culture
Make Craftsmanship Personal.
The Infragistics Way
The Infragistics Way describes the practices that guide our actions and decisions. It’s who we are, it’s who we want to be, and it’s essential to our success..
Do the Right Thing, Always.
Demonstrate an unwavering commitment to doing the right thing in every action you take and in every decision you make, especially when no one’s looking. Always tell the truth, no matter the consequences. If you make a mistake, own up to it, apologize, and make it right.
Deliver Results.
While we appreciate effort, we reward and celebrate results. Follow up on everything and take responsibility to ensure that tasks get completed. Set high goals, use measurements to track your progress, and hold yourself accountable for achieving those results.
Delight the Customer.
It's all about the experience. In every interaction, do the little things, as well as the big things, that delight people. Exceed expectations and deliver the "WOW" factor every chance you get. We’re here to make our customers jobs easier, and we do that by remaining focused on beauty and simplicity in all that we produce.
Be Fanatic About Response Time.
Respond to questions and concerns quickly, whether it's in person, on the phone, or by e-mail. This includes simply acknowledging that we got the question and we're "on it," as well as keeping those involved continuously updated on the status of outstanding issues.
Be Curious & Innovate.
In the search for the best solutions, be curious. Ask thoughtful questions and listen intently to the answers. Dig deeper to go beyond the expected. Take intelligent risks. Innovation, improvement, and success come from a thoughtful and intentional willingness to try the unconventional and to ask "What if?" Don't be afraid to make mistakes. Use sound judgment and validate your ideas with stakeholders whenever possible.
Check Your Ego at the Door.
It's not about you. Don't let your ego get in the way of doing what's best for the team. Worrying about who gets credit or taking things personally is counterproductive. Make sure every decision is based solely on advancing team goals and doing what's best for the customer.
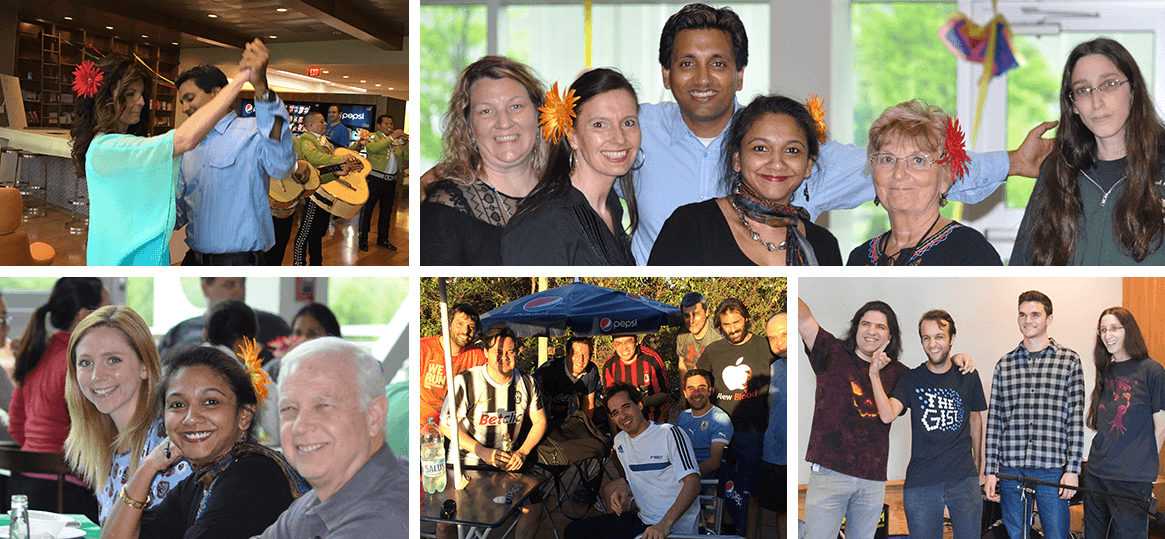
Our Values
Innovation. Commitment. Respect. At Infragistics our core values shape everything we do, from acquiring talent to creating simple and beautiful experiences that matter.
Interested in joining our team?
Explore our OpportunitiesOur Leaders
Great leaders breed great ideas. Meet the leaders behind our vision.

Phil Dinsmore
VP of Worldwide Sales

Holly Fee
VP of Marketing

Dean Guida
Founder & CEO

Jason Beres
Sr. VP of Developer Tools

Chris Rogers
Chief Financial Officer

Ken Azuma
Managing Director of APAC / Sr. UX Architect

Rohit Gaur
Managing Director of India

Vincent Nekhaev
Managing Director of EMEA
Our History
In the past 30+ years, Infragistics has grown exponentially - much like the technology landscape we are rooted in! Here's a brief overview of how we've expanded our influence since our start in 1989.

1989
Company Formed, US Offices Open
2000
Ultimate UI for Windows Forms & ASP.NET
2006
Tokyo Office Opens
Ultimate UI for WPF
2008
Services Division Formed
2010
HTML5/JavaScript Controls
2011
SharePlus
2012
Ultimate UI for iOS
Indigo Studio
2014
Ultimate UI for Xamarin & Android
2016
ReportPlus
2018
Angular & React Controls
Indigo.Design
2019
Blazor Controls
Reveal
2021
App Builder
Slingshot


Working Together and Pushing Boundaries
 Rutgers University
- React Framework
- Angular Framework
- Stevens Institute Technology
-

Supporting the Next Generation of Leaders in STEM
Infragistics has partnered with Rutgers Division of Continuing Studies, supporting students and faculty with access to it full portfolio of UX, UI and Analytics software including Infragistics Ultimate, Indigo.Design and Reveal.
Read More"We are thrilled to be able to offer our students, faculty and staff Infragistics software solutions that will accelerate their design, development, and collaboration efforts."
Lee Pagenkopf, Founding Manager, Rutgers Makerspace -
Serving the Microsoft and .NET Ecosystem
As a Gold Microsoft partner, Infragistics continues to be an active leader in the Microsoft developer ecosystem, providing controls, components and tools to streamline development of .NET applications on any platform or device.
"Infragistics has been a Microsoft partner for almost 3 decades. Through this close-knit relationship we’ve not only built technology that Microsoft has used in their products, but we’ve embraced and extended Microsoft platforms to deliver the tools and frameworks backed by .NET that our joint customers use as they build the next generation of enterprise applications."
Jason Beres, Sr. VP of Developer Tools, Infragistics -
Proud Contributor to and Supporter of Angular
Infragistics is an active contributor to the Angular ecosystem, working directly with the Angular team at Google to contribute to the open source Angular components, while also providing the most complete commercial library of Material-based, Angular-native UI components, Ignite UI for Angular.
"In the end I was really happy with my work. I learned a lot….finding that the people responsible for the project are open to new ideas and very friendly… and the feeling that you are contributing to a project used by tens of thousands of engineers is great."
Milko Venkov, Software Developer, Infragistics -
Supporting the Next Generation of Developers and Entrepreneurs
The Stevens Venture Center (SVC) is an innovative entrepreneurship ecosystem designed to connect Stevens entrepreneurs with infrastructure, resources and funding assistance so they can develop sustainable and successful commercial enterprises based on either Stevens-derived or individually conceived technologies.
Read More"We are grateful for the support from partners like Infragistics, which are willing to share their technology and UX/UI expertise."
Premal Kamdar, Entrepreneur in Residence at the Stevens Venture Center