Hey,
similarily to the xamDataChart is already able to, I'd love the ability to show marker values of some description in the UltraDataChart - at each place where you'd usually have a marker - so showing for multiple series, for example in bar/line/column/area charts (and their stacked variants).
Here's how my chart currently looks with the old chart:
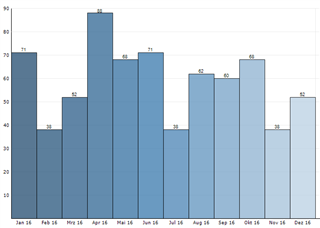
The little values above the columns are currently impossible to achieve.