React Spreadsheet: Not able to render excel with charts on example page
New DiscussionHi All ,
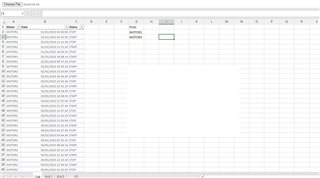
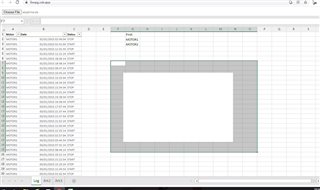
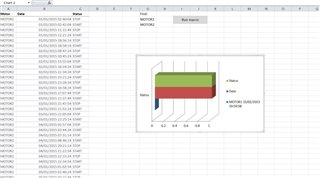
When I try the example as given on your page https://www.infragistics.com/products/ignite-ui-react/react/components/spreadsheet-overview
with an excel with charts. the output ui is not able to render the chart but I just see chart data.
My particular requirement is to create a read only excel viewer on my react web page that should render excel files as is (i.e. along with charts graphs images and all) .
Please let me know if this is possible via Ignite UI libraries.
Thanks
Kaveri M.
Sign In
to post a reply
Replies

- You must be logged in to reply to this topic.
Discussion created by
Favorites
Replies
Created On
Last Post
Discussion created by
Favorites
0 Replies
7 Created On
Feb 04, 2022 Last Post
4 years, 5 months ago Suggested Discussions
DISCUSSION
VIEWS
REPLIES
LAST POST
React Spreadsheet – drag and drop
I am testing the React Spreadsheet and have found a use case that I cannot get to work. I wish to b…
VIEWS
59,022
REPLIES
2
LAST POST
2 months ago Dialogbox div render twice when page loads
Hi, My codes are as below in as mvc view. <input type=”button” name=”btnOpen&#…
VIEWS
125,563
REPLIES
7
LAST POST
12 years ago Wrapping Text in an Excel Spreadsheet
I am exporting an UltraWebGrid to Excel using Infragistic's UltraWebGridExcelExporter, and I am…
VIEWS
45,178
REPLIES
2
LAST POST
18 years, 5 months ago Set page index to start of the page when grid data has changed
Version: Ultrawebgrid11.1 I have a grid whose DataSource is set in IntializeDataSource. I al…
VIEWS
29,911
REPLIES
4
LAST POST
14 years, 1 month ago