UltraChart.Axis.Y.NumericAxisType = NumericAxisType.Logarithmic
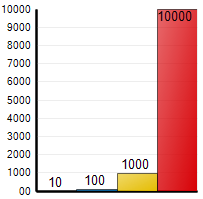
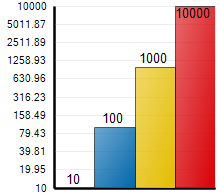
Sometimes it is necessary to plot very disparate data side-by-side on the same scale. When plotting such data on a linear scale, the smaller values become invisible while the larger ones occupy the entire scale. In these cases, use a logarithmic, not a linear, numeric type for your axis. This can be achieved by setting the NumericType property of the appropriate axis to Logarithmic .
UltraChart.Axis.Y.NumericAxisType = NumericAxisType.LogarithmicThere are certain situations where you want to use logarithmic axes even though your data contain zero values. Since there is no value for Log(0), we provide a property that allows you to specify a value when the axis tries to plot Log(0).
When Log(0) value is plotted, the tooltip will display "0" as the value. Also any click events will pass in the value 0 to the ChartDataEventArgs.
This property is supported for all chart types which support logarithmic axis. For more information, see Plot Log Zero Values.