

This topic explains how to display multiple series types in one chart or to use stacked series when working with multi-dimensional data (OnLine Analytical Processing (OLAP) data) in the XamDataChart™ control.
The following table lists the topics required as a prerequisite to understanding this topic.
This topic contains the following sections:
When you use the XamDataChart control to display data, you normally have a choice of the axes and series that you want rendered. This gives you full control over the series to be displayed. With the OlapXAxis on the other hand, you are limited to using a numeric y-axis and, by default, you can choose from a pre-defined set of series that can be displayed. The series type is managed by the DefaultSeries property which specifies what is being generated for all rows or columns of the current slice of the data.
To display single series, set the DefaultSeries property to any of the pre-defined series types. If the property is not set, column series are used. Because the OlapXAxis is an x-axis, you cannot use any kind of vertical series, e.g. Bar series. However, there are some other means to use series different from the predefined ones. If you want to display multiple types of series or if you want to use stacked series (which are not included in the OlapXAxisDefaultSeries enumeration), you must use the SeriesInitializing and SeriesCreating events.
This procedure takes you step-by-step toward displaying Column, Line, and Point series when using multi-dimensional data.
The following screenshot is a preview of the final result.
To complete the procedure, you need the following:
A WPF Visual Studio 2013-2017 application project with a XamDataChart configured with an OlapXAxis as described in the Visualizing Multi-Dimensional Data (OLAP Data) (XamDataChart) topic.
The following is a conceptual overview of the process:
1. Subscribing to the required events
2. Adding the required helper variables
3.Replacing the default series using a series-creating event
Subscribe to the SeriesCreating and SeriesInitializing events.
The SeriesCreating event occurs every time before a generated series is added to the data chart. The event handler for this event is where you replace the default series with series of your choosing. The SeriesInitializing event is raised before creation of all series has begun. This is for example when a user expands an axis label, or when a new hierarchy is added to the data source. After that for each series the SeriesCreating event is raised multiple times depending on the number of required series.
Add an integer variable for keeping the current count of series.
In the example in this procedure, an integer variable is used to hold the count of the series that are currently created. This is needed in order to be able to identify different occurrences of the SeriesCreating event. When the SeriesInitializing event is raised, set this variable to zero and, on SeriesCreating, increment it. Based on the value of this field we create different types of series.
This approach is used for simplicity, but you can implement some more sophisticated logic to choose what types of series should be used, for example based on to what measures used in the data source the series correspond.
To display the desired type of series, you need to create a new series and set it as the value of the Series property of the SeriesCreatingEventArgs. The Series to be used are provided as arguments to the SeriesCreating event. These arguments also contain an OlapSeriesInfo object with all the information needed to create the new series.
To create a new series and assign the required properties:
1. Set the ItemsSource of the series to the ItemsSource provided by the SeriesInfo * .*
2. Set the ValueMemberPath * property.*
The data source is a list of OlapAxisCell objects. The value that you have to bind to is to be found in the Value property of the Cell associated with the OlapAxisCell object.
This means that the ValueMemberPath has to be “`Cell.Value”`.
3. Set the Name * property to the name supplied with the series info.*
4. Set the Title * to the one from the series info.*
Following is the complete code of the procedure.
In XAML:
<UserControl
…
      xmlns:ig="http://schemas.infragistics.com/xaml"
      xmlns:models="clr-namespace:Infragistics.Samples.Data.Models"
      xmlns:olap="http://schemas.infragistics.com/olap">
<UserControl.Resources>
        <ResourceDictionary>
            <models:SalesDataSample x:Key="DataSample"/>
            <olap:FlatDataSource
                x:Key="DataSource"
                Columns="[Date].[Date]"
                Measures="AmountOfSale, NumberOfUnits"
                MeasureListLocation="Rows"
                ItemsSource="{StaticResource DataSample}" />
        </ResourceDictionary>
    </UserControl.Resources>
    <Grid x:Name="LayoutRoot" Background="White">
        <Grid.ColumnDefinitions>
            <ColumnDefinition />
            <ColumnDefinition Width="Auto"/>
        </Grid.ColumnDefinitions>
        <ig:XamDataChart x:Name="DataChart" HorizontalZoomable="True" VerticalZoomable="True" Width="700" >
            <ig:XamDataChart.Axes>
                <ig:NumericYAxis x:Name="YAxis" MinimumValue="0"/>
                <ig:OlapXAxis
                    YAxis="{Binding ElementName=YAxis}"
                    DataSource="{StaticResource DataSource}"
                    OlapAxisSource="Columns"
                    DefaultSeries="ColumnSeries"
                    SeriesInitializing="OlapXAxis_SeriesInitializing"
                    SeriesCreating="OlapXAxis_SeriesCreating"/>
            </ig:XamDataChart.Axes>
        </ig:XamDataChart>
    </Grid>
</UserControl>
In C#:
…
public partial class MainPage : UserControl
    {
        int seriesIndex = 0;
        public MainPage()
        {
            InitializeComponent();
        }
        private void OlapXAxis_SeriesCreating(object sender, Infragistics.Controls.Charts.SeriesCreatingEventArgs e)
        {
            switch (seriesIndex)
            {
                case 0:
                    e.Series = new ColumnSeries()
                    {
                        ItemsSource = e.SeriesInfo.ItemsSource,
                        ValueMemberPath = "Cell.Value",
                        Title = e.SeriesInfo.Title,
                        Name = e.SeriesInfo.Name
                    };
                    break;
                case 1:
                    e.Series = new LineSeries()
                    {
                        ItemsSource = e.SeriesInfo.ItemsSource,
                        ValueMemberPath = "Cell.Value",
                        Title = e.SeriesInfo.Title,
                        Name = e.SeriesInfo.Name
                    };
                    break;
                case 2:
                    e.Series = new PointSeries()
                    {
                        ItemsSource = e.SeriesInfo.ItemsSource,
                        ValueMemberPath = "Cell.Value",
                        Title = e.SeriesInfo.Title,
                        Name = e.SeriesInfo.Name
                    };
                    break;
            }
            seriesIndex++;
        }
        private void OlapXAxis_SeriesInitializing(object sender, Infragistics.Controls.Charts.SeriesInitializingEventArgs e)
        {
            seriesIndex = 0;
        }
In Visual Basic:
Imports Infragistics.Controls.Charts
Partial Public Class MainPage
    Inherits UserControl
    Private seriesIndex As Integer
    Public Sub New()
        InitializeComponent()
    End Sub
    Private Sub OlapXAxis_SeriesInitializing(sender As System.Object, e As SeriesInitializingEventArgs)
        seriesIndex = 0
    End Sub
    Private Sub OlapXAxis_SeriesCreating(sender As System.Object, e As SeriesCreatingEventArgs)
        Select Case seriesIndex
            Case 0
                e.Series = New ColumnSeries() With { _
                 .ItemsSource = e.SeriesInfo.ItemsSource, _
                 .ValueMemberPath = "Cell.Value", _
                 .Title = e.SeriesInfo.Title, _
                 .Name = e.SeriesInfo.Name _
                }
                Exit Select
            Case 1
                e.Series = New LineSeries() With { _
                 .ItemsSource = e.SeriesInfo.ItemsSource, _
                 .ValueMemberPath = "Cell.Value", _
                 .Title = e.SeriesInfo.Title, _
                 .Name = e.SeriesInfo.Name _
                }
                Exit Select
            Case 2
                e.Series = New PointSeries() With { _
                 .ItemsSource = e.SeriesInfo.ItemsSource, _
                 .ValueMemberPath = "Cell.Value", _
                 .Title = e.SeriesInfo.Title, _
                 .Name = e.SeriesInfo.Name _
                }
                Exit Select
        End Select
        seriesIndex += 1
    End Sub
End ClassWhen using stacked series, you need a data source that contains objects with all the values that you want to display as stack pieces. However the data sources provided for each series only contain the values for one series. Therefore, you have to create a custom class to save the values needed to display the series. This way you add one stacked series to the chart and populate their Series collection with multiple StackedFragmentedSeries that have a common data source.
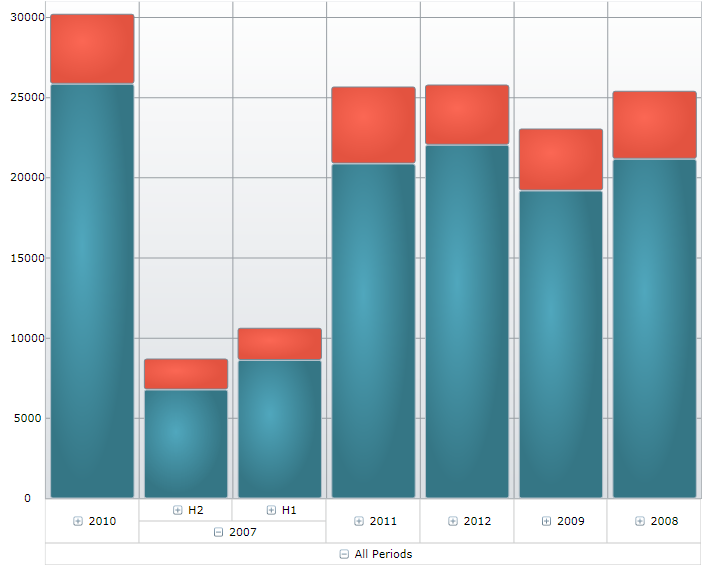
The following screenshot is a preview of the final result.
To complete the procedure, you need the following:
A WPF Visual Studio 2013-2017 application project with a XamDataChart configured with an OlapXAxis as described in the Visualizing Multi-Dimensional Data (OLAP Data) (XamDataChart) topic.
Understanding of the Stacked Series type of the XamDataChart . For information, refer to the Stacked Column Series topic.
This topic takes you step-by-step toward replacing the default series used with an OlapXAxis with StackedColumnSeries. The following is a conceptual overview of the process: 1. Subscribing to the required events2. Adding the required helper variables3. Adding the helper class for storing the series’ data 4. Replacing the default series using the events
Subscribe to the SeriesCreating and SeriesInitializing events.
The SeriesCreating event occurs every time before a generated series is added to the data chart. The SeriesInitializing event is raised before creation of all series has begun. This is the case, for instance, when a user expands an axis label, or when a new hierarchy is added to the data source. After that, for each series, the SeriesCreating event is raised as many times as the number of required series.
1. Add an integer variable for keeping the current count of series.
In the example in this procedure, an integer variable is used to store the current count of the created StackedFragmentedSeries. This is needed for the sake of identifying the different occurrences of the SeriesCreating event. When the SeriesInitializing event is raised, set this variable to 0 and, on SeriesCreating , increment it .
2. Add a StackedColumnSeries * variable to use in the chart.*
In addition to the integer field, you must have a StackedColumnSeries field to store a reference to the stacked column series that are to be used in the data chart. If you want, you can replace this with any kind of stacked series that derives from HorizontalStackedSeriesBase, the rest of the code will be practically the same.
In order to be able to create the common data source for the stacked series, add a class that contains a list of double values . The purpose of this list is to store the settings of each of the series’ data sources. When all the data sources of the series are added to the list, it is used as the ItemsSource of the StackedColumnSeries.
In C#:
private class StackedSeriesData
{
    public StackedSeriesData()
    {
        Data = new List<double>();
    }
    public List<double> Data { get; set; }
}
In Visual Basic:
 Private Class StackedSeriesData
        Public Property Data As List(Of Double)
        Public Sub New()
            Data = New List(Of Double)
        End Sub
End Class1. In the SeriesInitializing event handler, initialize the series and set the counter to 0 * .*
This means to assign the series variable added in step 2 a new instance of the StackedColumnSeries. This way, every time a SeriesCreating is raised, you can replace the automatically generated series with the stacked ones.
In C#:
private void OlapXAxis_SeriesInitializing(object sender, Infragistics.Controls.Charts.SeriesInitializingEventArgs e)
{
    series = new StackedColumnSeries();
    seriesIndex = 0;
}
In Visual Basic:
Private Sub OlapXAxis_SeriesInitializing(sender As Object, e As Infragistics.Controls.Charts.SeriesInitializingEventArgs)
      series = New StackedColumnSeries()
      seriesIndex = 0
End Sub
2. Create the common data source when the first time SeriesCreating is raised.
In the SeriesCreating event handler, check if the series counter is 0 . If so, this means that this is the first time the event is raised for the current state of the data source and you must to create the new data source that will be common for all stacked fragmented series.
In C#:
private void OlapXAxis_SeriesCreating(object sender, Infragistics.Controls.Charts.SeriesCreatingEventArgs e)
{
    if (seriesIndex == 0)
    {
        series.ItemsSource = Enumerable.Range(0, e.SeriesInfo.ItemsSource.Count).Select(i => new StackedSeriesData()).ToList();
    }
…
In Visual Basic:
Private Sub OlapXAxis_SeriesCreating(sender As System.Object, e As SeriesCreatingEventArgs)
    If seriesIndex = 0 Then
        series.ItemsSource = Enumerable.Range(0, e.SeriesInfo.ItemsSource.Count).[Select](Function(i) New StackedSeriesData()).ToList()
    End If
3. Populate the common data source and add StackedFragmentedSeries to the stacked series.
After you have populated the StackedColumnSeries’ ItemsSource the first time when SeriesCreating is raised, you must add the items supplied with the current SeriesInfo.ItemsSource to the common data source.
In C#:
…
for (int i = 0; i < e.SeriesInfo.ItemsSource.Count; i++)
{
    ((List<StackedSeriesData>)series.ItemsSource)[i].Data.Add(Convert.ToDouble(e.SeriesInfo.ItemsSource[i].Cell.Value));
}
…
In Visual Basic:
…
For i = 0 To e.SeriesInfo.ItemsSource.Count - 1
    DirectCast(series.ItemsSource, List(Of StackedSeriesData))(i).Data.Add(Convert.ToDouble(e.SeriesInfo.ItemsSource(i).Cell.Value))
Next
…
4. Create and configure the StackedFragmentedSeries.
Create the StackedFragmentedSeries and add them to the StackedColumnSeries* .*
Increment the series counter.
Set the StackedColumnSeries as the value of the Series property of the event arguments.
In C#:
…
    series.Series.Add(new StackedFragmentSeries() { ValueMemberPath = string.Format("Data[{0}]", seriesIndex), Title = e.SeriesInfo.Title });
    e.Series = series;
    seriesIndex++;
}
In Visual Basic:
…
    series.Series.Add(New StackedFragmentSeries() With { _
     .ValueMemberPath = String.Format("Data[{0}]", seriesIndex), _
    .Title = e.SeriesInfo.Title
    })
    e.Series = series
    seriesIndex = seriesIndex + 1
End SubFollowing is the full C# and VB.NET code of the procedure. For the XAML code, use the code snippet listed in the Code block of Displaying Multiple Series Types.
In C#:
…
public partial class MainPage : UserControl
    {
        int seriesIndex = 0;
        StackedColumnSeries series;
        public MainPage()
        {
            InitializeComponent();
        }
        private class StackedSeriesData
        {
            public StackedSeriesData()
            {
                Data = new List<double>();
            }
            public List<double> Data { get; set; }
        }
        private void OlapXAxis_SeriesCreating(object sender, Infragistics.Controls.Charts.SeriesCreatingEventArgs e)
        {
            if (seriesIndex == 0)
            {
                series.ItemsSource = Enumerable.Range(0, e.SeriesInfo.ItemsSource.Count).Select(i => new StackedSeriesData()).ToList();
            }
            for (int i = 0; i < e.SeriesInfo.ItemsSource.Count; i++)
            {
                ((List<StackedSeriesData>)series.ItemsSource)[i].Data.Add(Convert.ToDouble(e.SeriesInfo.ItemsSource[i].Cell.Value));
            }
            series.Series.Add(new StackedFragmentSeries() { ValueMemberPath = string.Format("Data[{0}]", seriesIndex), Title = e.SeriesInfo.Title });
            e.Series = series;
            seriesIndex++;
        }
        private void OlapXAxis_SeriesInitializing(object sender, Infragistics.Controls.Charts.SeriesInitializingEventArgs e)
        {
            series = new StackedColumnSeries();
            seriesIndex = 0;
        }
}
In Visual Basic:
Imports Infragistics.Controls.Charts
Partial Public Class MainPage
    Inherits UserControl
    Private Class StackedSeriesData
        Public Property Data As List(Of Double)
        Public Sub New()
            Data = New List(Of Double)
        End Sub
    End Class
    Private series As StackedColumnSeries
    Private seriesIndex As Integer
    Public Sub New()
        InitializeComponent()
    End Sub
    Private Sub OlapXAxis_SeriesInitializing(sender As System.Object, e As SeriesInitializingEventArgs)
        series = New StackedColumnSeries()
        seriesIndex = 0
    End Sub
    Private Sub OlapXAxis_SeriesCreating(sender As System.Object, e As SeriesCreatingEventArgs)
        If seriesIndex = 0 Then
            series.ItemsSource = Enumerable.Range(0, e.SeriesInfo.ItemsSource.Count).[Select](Function(f) New StackedSeriesData()).ToList()
        End If
        For i = 0 To e.SeriesInfo.ItemsSource.Count - 1
            DirectCast(series.ItemsSource, List(Of StackedSeriesData))(i).Data.Add(Convert.ToDouble(e.SeriesInfo.ItemsSource(i).Cell.Value))
        Next
        series.Series.Add(New StackedFragmentSeries() With { _
         .ValueMemberPath = String.Format("Data[{0}]", seriesIndex), _
        .Title = e.SeriesInfo.Title
        })
        e.Series = series
        seriesIndex += 1
    End Sub
End ClassThe following topics provide additional information related to this topic.