
Zoom Fast with Ignite UI for JavaScript Zoombar
Ignite UI for JavaScript provides a Zoombar control to zoom range-enabled controls like data charts. Use Zoombar to zoom in on a widget in a resizable zoom-range window. Zoombar includes a horizontal scroll bar that can zoom either the whole range or a particular section of the chart. Zoombar works as a stand-alone control.
Learn more about other Ignite UI for JavaScript features on the Ignite UI product page.
In this lesson, you will learn to configure the Ignite UI for JavaScript Zoombar with a data chart.
At the end of this lesson, you will have an Ignite UI for JavaScript chart that is configured with Ignite UI for JavaScript Zoombar in an Angular application.
Learn more about Ignite UI for JavaScript Angular components; you can also learn more about Angular in Angular Essentials, a free eBook published by Infragistics.
Lesson Objectives
- Add a Zoombar to the application.
- Configure Zoombar with an Ignite UI for JavaScript chart.
For more information on the controls used in this lesson, see Ignite UI Zoombar.
Setting up the Project
You may download the starter project for this lesson by clicking here. (You can also download the final project by clicking here.)
After downloading the project, navigate to the directory and run the commands below:
- npm install
- npm start
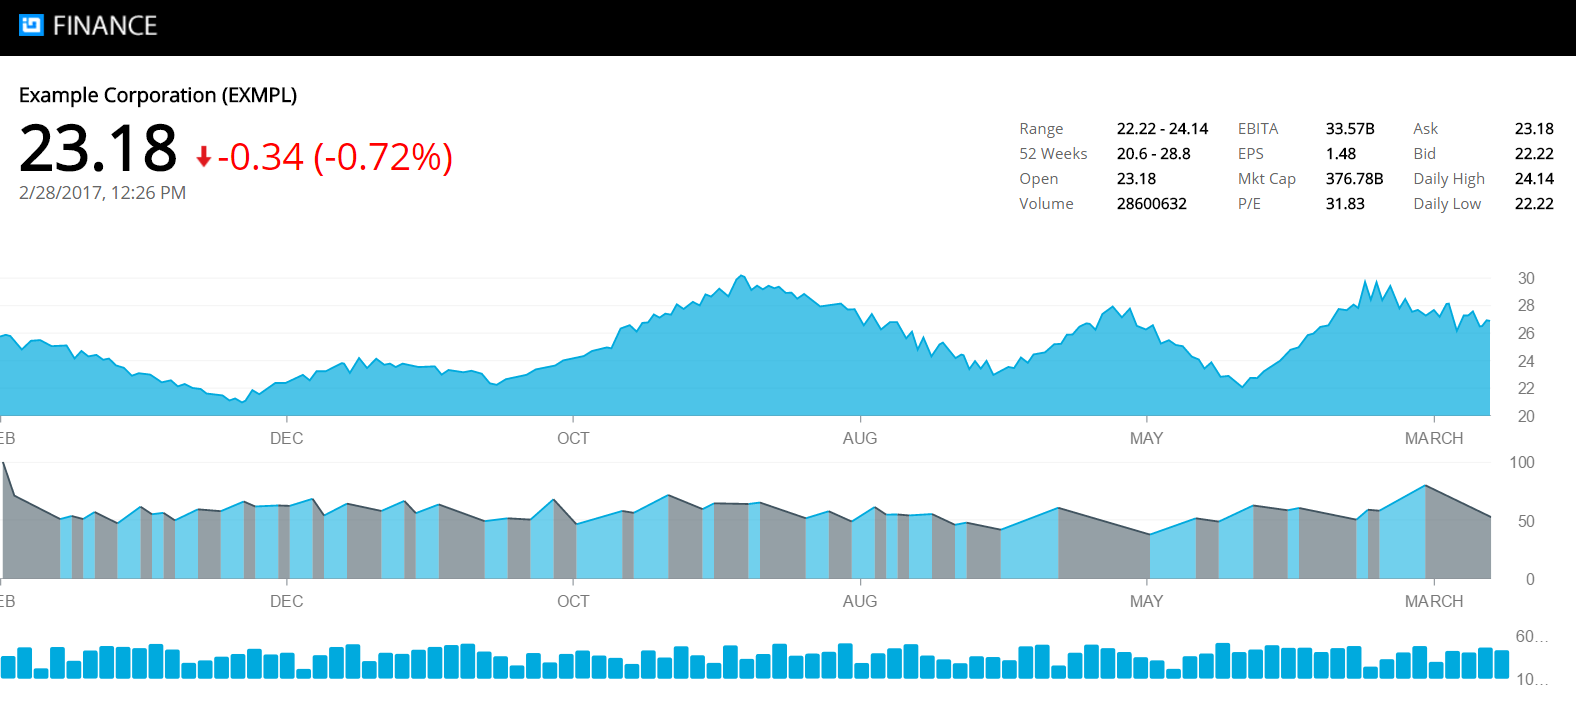
Execute the npm install command to install all dependencies, and execute the npm start command to run the Angular application. If the project is set up correctly, you will have a running Angular application as shown in the image below. If you receive an error while running the application, stop and run the npm start command again.
Step 1 Import and Declare the Component
To work with Ignite UI for JavaScript Angular components, you must import and declare them in the module. For example, to use the igGrid component in an Angular application, import and declare the IgGridComponent in the application module.
Navigate to the Finance App folder and then the app folder. Open the file app.module.ts, and add the import statements shown below, just after all of the existing import statements:
import { IgZoombarComponent } from 'igniteui-angular2';After importing the required components, you must declare them in the application module. Add IgZoombarComponent in the AppModule’s declaration array. Modify @NgModule decorator in app.module.ts as shown below:
@NgModule({
  imports: [BrowserModule, HttpModule],
  declarations: [AppComponent,
  IgDataChartComponent,
  InfoComponent,
  IndicatorChartComponent,
  VolumeChartComponent,
  IgGridComponent,
  GridComponent,
  PriceChartComponent,
  IgZoombarComponent,
  ],
  providers: [AppService],
  bootstrap: [AppComponent]
})
You have added IgZoombarComponent in the declaration array of the AppModule module. Other added components and other properties, like providers, will be reviewed in subsequent lessons.
Step 2 Add Zoombar
To work with an Ignite UI for JavaScript Zoombar, you must first add the Zoombar component. In the app\charts folder, open the volumechart.component.html file and add the ig-zoombar control as shown below, just after the ig-data-chart control:
<ig-zoombar [(options)]="zoombarOptions" widgetId="zoombar"></ig-zoombar>Step 3 Add Zoombar Options Property
In the Zoombar option, you can attach a chart to the Zoombar. To configure the Zoombar option, create a property in the VolumeChartComponent class. In the app\charts folder, open the volumechart.component.ts file and, just above the constructor, add the property listed below:
private zoombarOptions: IgZoombar;Step 4 Attach Chart to Zoombar
To attach a chart widget to Zoombar, you must set the target property value of Zoombar options to the ID of the chart widget. In the app\charts folder, open the volumechart.component.ts file and add the code below, just after the this.chartOptions assignment in the ngOnInit() function:
this.zoombarOptions = {
  target: "#volumechart"
};
In the above listing, volumechart is the ID of the data chart widget.
Step 5 Run the Application
Navigate to the application and scroll down to the bottom of the page to find the Zoombar added as shown in the image below:
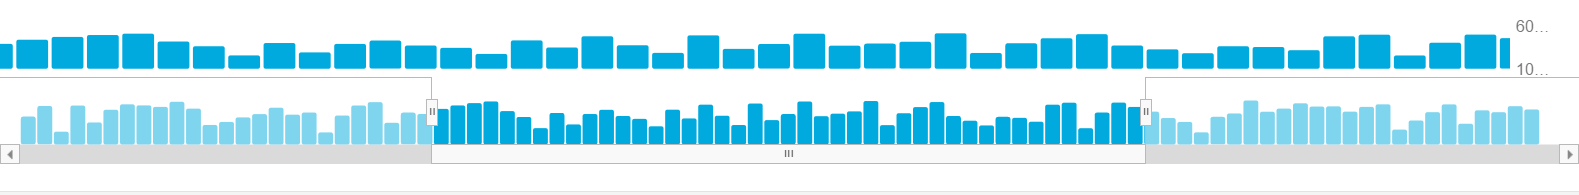
The chart has been cloned in the Zoombar and you can use the horizontal scroll bar to quickly and smoothly zoom in and out within the chart, regardless of how many data points are rendered in the chart.
Conclusion
Ignite UI for JavaScript can be very helpful for writing and running web applications more quickly. In addition to Angular, you may use Ignite UI for JavaScript in React, AngularJS, jQuery, and ASP.NET MVC.