Replies
Hi Michael
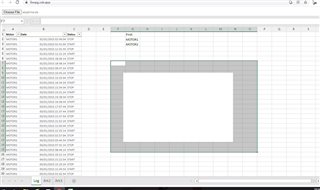
Apologies, Its a Typo. I am referring to a blank spot / area in the middle of screen .
PFA screenshot
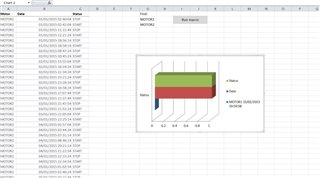
Ideally a colored chart must appear in the blank area like below.
Code sandbox link
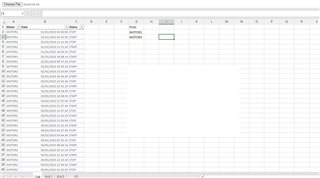
Also sharing Sample file I used .
Hi Michael ,
I have observed an issue with rendering charts on .xls files.
As you can see in the screenshot I am getting a black spot in the middle of excel.
Also adding the code.
import React from 'react';
import ReactDOM from 'react-dom';
import './index.css';
import { ExcelUtility } from './ExcelUtility';
import { IgrExcelXlsxModule } from 'igniteui-react-excel';
import { IgrExcelCoreModule } from 'igniteui-react-excel';
import { IgrExcelModule } from 'igniteui-react-excel';
import { IgrSpreadsheetModule } from 'igniteui-react-spreadsheet';
import { IgrSpreadsheet } from 'igniteui-react-spreadsheet';
import { IgrSpreadsheetChartAdapterModule } from 'igniteui-react-spreadsheet-chart-adapter';
import { SpreadsheetChartAdapter } from 'igniteui-react-spreadsheet-chart-adapter';
import { Worksheet } from 'igniteui-react-excel';
import { WorksheetCell } from 'igniteui-react-excel';
import { ChartType, ChartTitle, FormattedString } from 'igniteui-react-excel';

IgrExcelCoreModule.register();
IgrExcelModule.register();
IgrExcelXlsxModule.register();
IgrSpreadsheetModule.register();
IgrSpreadsheetChartAdapterModule.register();

export default class SpreadsheetAdapterForCharts extends React.Component {
public spreadsheet: IgrSpreadsheet;

constructor(props: any) {
super(props);
this.onSpreadsheetRef = this.onSpreadsheetRef.bind(this);
}

public render(): JSX.Element {
return (
<div className="container sample">
<div className="options horizontal">
<input type="file" onChange={(e) => this.openFile(e.target.files as FileList)} accept=".xls, .xlt, .xlsx, .xlsm, .xltm, .xltx"/>
</div>
<IgrSpreadsheet ref={this.onSpreadsheetRef} height="calc(100% - 30px)" width="100%" />
</div>
);
}
public openFile(selectorFiles: FileList) {
if (selectorFiles != null && selectorFiles.length > 0) {
ExcelUtility.load(selectorFiles[0]).then((w) => {
this.spreadsheet.workbook = w;
}, (e) => {
console.error("Workbook Load Error");
});
}
}

public onSpreadsheetRef(spreadsheet: IgrSpreadsheet) {
if (!spreadsheet) { return; }

this.spreadsheet = spreadsheet;
this.spreadsheet.chartAdapter = new SpreadsheetChartAdapter();
const url = "https://static.infragistics.com/xplatform/excel/SalesData.xlsx"
ExcelUtility.loadFromUrl(url).then((w) => {
this.spreadsheet.workbook = w;
});
}
/*
public onSpreadsheetRef(spreadsheet: IgrSpreadsheet) {

if (spreadsheet) {

this.spreadsheet = spreadsheet;
this.spreadsheet.chartAdapter = new SpreadsheetChartAdapter();
const url = "https://static.infragistics.com/xplatform/excel/ChartData.xlsx";
// ExcelUtility.loadFromUrl(url);
ExcelUtility.loadFromUrl(url).then((w) => {
this.spreadsheet.workbook = w;

const sheet: Worksheet = this.spreadsheet.workbook.worksheets(0);

sheet.defaultColumnWidth = 450 * 20;
sheet.rows(0).height = 150 * 20;

const cell1: WorksheetCell = sheet.getCell("A1");
const cell2: WorksheetCell = sheet.getCell("B1");
const cell3: WorksheetCell = sheet.getCell("C1");
const cell4: WorksheetCell = sheet.getCell("D1");

const dataCellAddress = "A3:D6";

const title: ChartTitle = new ChartTitle();
title.text = new FormattedString("Line Chart");
const chart1 = sheet.shapes().addChart(ChartType.Line, cell1, { x: 5, y: 5 }, cell1, { x: 90, y: 90 });
chart1.chartTitle = title;
chart1.setSourceData(dataCellAddress, true);

const title2: ChartTitle = new ChartTitle();
title2.text = new FormattedString("Column Chart");
const chart2 = sheet.shapes().addChart(ChartType.ColumnClustered, cell2, { x: 5, y: 5 }, cell2, { x: 90, y: 90 });
chart2.chartTitle = title2;
chart2.setSourceData(dataCellAddress, true);

const title3: ChartTitle = new ChartTitle();
title3.text = new FormattedString("Area Chart");
const chart3 = sheet.shapes().addChart(ChartType.Area, cell3, { x: 5, y: 5 }, cell3, { x: 90, y: 90 });
chart3.chartTitle = title3;
chart3.setSourceData(dataCellAddress, true);

const title4: ChartTitle = new ChartTitle();
title4.text = new FormattedString("Pie Chart");
const chart4 = sheet.shapes().addChart(ChartType.Pie, cell4, { x: 5, y: 5 }, cell4, { x: 90, y: 90 });
chart4.chartTitle = title4;
chart4.setSourceData(dataCellAddress, true);
});
}
}*/
}

// rendering above class to the React DOM
ReactDOM.render(<SpreadsheetAdapterForCharts />, document.getElementById('root'));
Actual file looks like this ->

Is it like this utility only supports .xlsx files?
Hi ,
Thanks for this Information.
We tried to implement the same but when we try to open large spreadsheets ~5mb in size the app fails to render the same on UI .
Pls check following code in Exceluitlity
Workbook.load(data, new WorkbookLoadOptions(), (w) => {
resolve(w);
}, (e) => {
reject(e);
});
We are getting this error :
Index was out of range. It must be non-negative and less than the size of the collection.