Infragistics Ultimate 25.1 Release: Updates You Shouldn’t Miss
From brand-new components to exciting new features - here's everything you need to know about the Infragistics Ultimate 25.1 Release. Angular 19 updates, more charting capabilities, AI functionalities, and beyond.
Here at Infragistics, 2025 is off to a strong start. Our mission has always been to empower organizations and developers to drive innovation, boost productivity, and achieve a competitive edge with the solutions they build. At the same time, being dedicated to quality and efficiency, we make sure that every toolset is continuously enhanced. That’s why, in the first half of the year, we’ve packed Infragistics Ultimate 25.1 with powerful new features and updates to help you develop modern, high-performance, and engaging apps across every platform.
Take a look at everything that has been released in Infragistics Ultimate 25.1!
What’s New in App Builder?
Exclusive to Infragistics Ultimate, App Builder is the only low-code tool that provides teams with full code ownership and deep customization. And now, the most recent updates to the platform allow you to leverage AI-driven functionality to generate application views, images, and data sources.
Here are the highlights.
Multiple-Actions Support, AI View Generation, & Remote Data Handling
- Multiple-Actions Support: enabling a single interaction (e.g. click, row selection) to now trigger multiple actions, for enhanced flexibility when handling complex workflows.
- AI-Powered View Creation: introducing generative AI features for view creation, allowing users to generate UI layouts and components using free-text prompts.
- Remote Data Handling: efficiently managing large datasets using components like Card, Row, and Column layouts, improving performance by dynamically fetching data from remote servers.
New Indigo UI Kit for Figma
- Custom in-house theme designed to elevate users’ apps with a modern and unique aesthetic.
- New variants for components, enhanced customization, and design improvements.
- Automatic Value Binding for Grid Column Templates to simplify template configurations for grid columns, save time, and reduce errors by automatically binding the template to the underlying field value.
Additional Updates
- New Carousel Component.
- Grid Summaries configurator for toggling column-based visibility of operands.
Preview Release
- Conversational AI Experience for generating design elements with AI as an experimental feature.
- Query Variable type interacting with data sources, designed to efficiently handle large datasets by dynamically filtering data through API requests.
- Query Builder Component added to the toolbox, seamlessly integrating with the Query Variable for optimized data management and UI-driven filtering.
What’s Next for App Builder?
- Enable Child-level Routing with Path params.
- Hierarchical Grid Load data on demand functionality.
- Data Validation in App Builder, for Grid, Form, and all form-based components.
- Grid Multi-Column Headers Support.
- Multiple actions executed based on a condition.
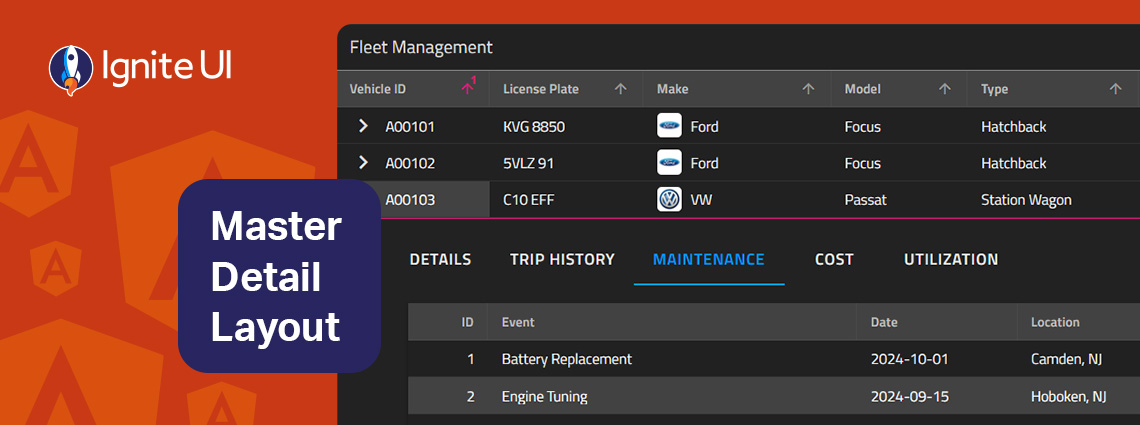
- Grid Templating for Master-Detail, Loading Indicator, Empty Grid Template.
- Integration with Azure DevOps.
Read more here:
Multiple-Actions Support, AI View Generation & Remote Data Handling
Initial Advanced Filtering, New AI Chat UI, & Query Builder
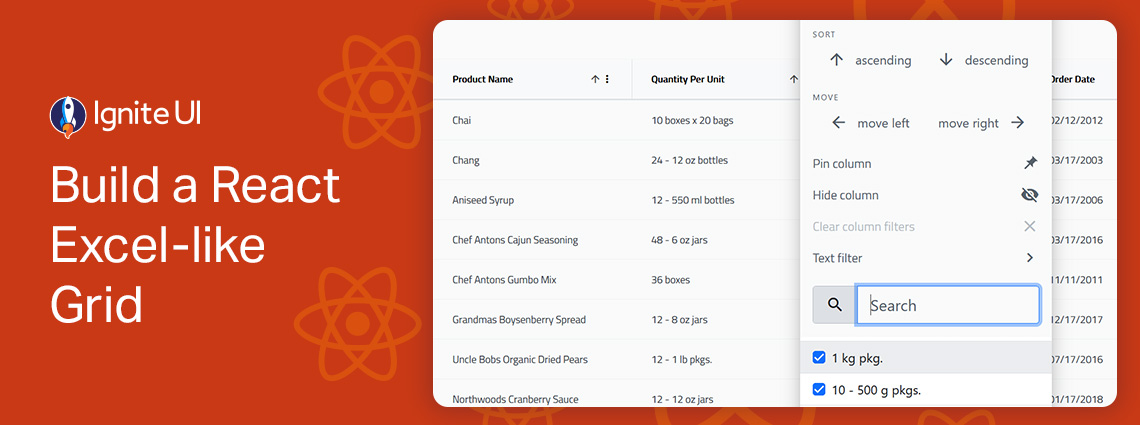
What’s New in the Ignite UI Toolbox?
Ignite UI is a comprehensive library of hundreds of UI components for every major web framework. It brings the fastest grids and data charts on the market, optimized for speed and performance.
Here are the latest updates delivered in Infragistics Ultimate 25.1.
Ignite UI for Angular
- Ignite UI Angular Grid component received a significant update to its SSR (server-side rendering) and SSG (prerendering). With 19.2, it now renders all its inner elements with appropriate relative sizes, allowing seamless client rehydration and subsequent databinding.
- Tile Manager Component enables the display of content in individual tiles, allowing users to interact with these tiles by rearranging and resizing them, giving them the freedom to customize the layout and appearance of the content.
- Query Builder Component providing enhanced design, multi-table query support, nested queries, and more, enabling developers to build complex data filtering queries.
- Angular 19 Support introducing powerful features and new designs.
- Carousel Component with an updated design and vertical orientation for navigation buttons.
- Dashboard Tile: a new charting feature allowing users to easily build interactive dashboards (available in preview).
- Brand-new, customizable Angular Grid samples to use right away.
Read more here:
Building Dashboards with Ease Using Dashboard Tile
Ignite UI for Angular Grid Samples
Ignite UI for Blazor
- Dashboard Tile: a new charting feature for building interactive dashboards with ease (available in preview).
- Grids Declarative Filtering (Initial filtering state).
Ignite UI for React
- Dashboard Tile: a new charting feature enabling users to build interactive dashboards with ease (available in preview).
- React Wrappers.
- Grids Declarative Filtering (Initial filtering state).
- Ignite UI for React version 19: we’ve made fundamental changes under the hood, migrating from class-based to function-based components, aligning event handling with native web and React conventions for a more intuitive experience, and simplifying imports. This way, you can jump straight into app building. Version 19 also streamlines your coding by eliminating the need for non-functional name and key properties where they aren’t required, providing improved types and type checking for greater code reliability, and significantly reducing the library’s size.
- NOTE: Documentation and Samples updates are in progress and are expected by the mid of June.
Ignite UI for Web Components
- Tile Manager Component: a brand-new, time-saving component with features like resizing, reordering, and serialization that ensure agility and optimal user experience when displaying content in individual tiles.
- Dashboard Tile: a new charting feature for building interactive dashboards with ease (available in preview). This smart component automatically analyzes your data source—whether it’s a collection, array, or single value—and selects the most impactful visualization to bring your insights to life. From Category Charts and Financial Charts to Geographic Maps, Gauges, and more, the Dashboard Tile adapts to your data’s shape with a wide range of stunning visuals. Plus, with the built-in IgcToolbarComponent, you can easily fine-tune and switch between visualizations on the fly, giving you full control with just a few clicks. It’s dynamic, intuitive, and designed to make your data more than just informative.
- Grids Declarative Filtering (Initial filtering state)
- File Input Component.
- Tooltip Component.
Read more here:
Ultimate UI for WPF
- Dashboard Tile: a new charting feature allowing users to easily build interactive dashboards (available in preview).
- Data Pie Chart: for simple or exploded pie charts, enabling developers to customize the threshold and display text or images.
Ultimate UI for Windows Forms
- Data Pie Chart for better visualizations, enabling programmers to add customizations to the threshold and show text or images.
This represents a sleek, specialized control designed to showcase categorical data in a bold, easy-to-digest format. A clean circular layout that divides data into proportional segments makes it perfect for highlighting key insights when you have a few meaningful categories to display. Ideal for dashboards, reports, or presentations where clarity and visual impact matter most.
Here’s everything at a glance.
Wrap Up
Designed to enhance your app development process, the Infragistics Ultimate 25.1 release empowers you to create visually stunning, high-performance apps more efficiently than ever before with better tools and features.
To experience everything in the latest App Builder updates, visit the customer portal and get the latest version.
Follow Ignite UI on Medium to stay up-to-date and learn about the latest UI/UX-related projects we are working on. Give us a star on GitHub and help us continue improving our product by addressing any concerns, questions, or feature requests in the issues section.