5 React Grid Examples That Will Transform Your Next Project
To help you get a clear view of what a Grid can do, I’ve put together 5 React Grid examples built with Ignite UI for React. These React sample apps will show you how different grids perform in real-world scenarios, including powering sales dashboards, managing large-scale ERP systems, and more.
When building high-performance React apps where users need to analyze and interact with data, features like grouping and pivoting all points to one essential component: grids. No matter how sleek your UI looks or how many features you add, if the grid rendering that data lags or stutters, the entire user experience takes a hit.
Let’s take a sales management dashboard as an example. Imagine a sales manager using the dashboard to track leads, monitor team performance, and follow live sales figures. If the Grid is slow to update or can’t handle the volume of data, it doesn’t just frustrate the user. It leads to:
- Missed opportunities
- Inaccurate reporting
- And slower decision-making
That’s why having a versatile React Grid is no longer optional for your next application. It’s a necessity that allows you to keep pace with real-time business demands. With the right grid, any team gains clarity, speed, and performance in their data, turning insights into action almost instantly.
To help you get a clear view of what a Grid can do, I’ve put together 5 React Grid examples built with Ignite UI for React. These React sample apps will show you how different grids perform in real-world scenarios, including powering sales dashboards, managing large-scale ERP systems, and more.
A Brief Look at My Top Picks: 5 React Grid Examples
| React Grid Examples | Key Components | Key Features | Best-Fit Scenario |
|---|---|---|---|
| ERP/Inventory | Hierarchical Grid, Data Chart, Rating, Dialog, Badge, Button, Icon, Excel Exporter Service, CSV Exporter Service | Row Selection, Sorting, Filtering, Column Moving, Column Hiding, Column Pinning, Exporting | Tracking and managing quantity, location, and details of products in stock. |
| Org Chart/HR | Tree Grid, Avatar, Button, Icon, Paginator, Excel Exporter Service, CSV Exporter Service | Row Selection, Sorting, Excel Style Filtering, Column Hiding, Column Pinning, Exporting, Paging | Displaying company’s hierarchical structure and showing employees data. |
| Financial Portfolio | Data Grid, Avatar, Button, Icon, Linear Bar, Input Group, Excel Exporter Service, CSV Exporter Service | Row Selection, Sorting, Column Hiding, Column Pinning, Exporting, Conditional Cell Styling, Filtering | Asset tracking, profit and loss analyses, featuring interactive dynamic charts. |
| Sales Dashboard | Pivot Grid, Pivot Data Selector, Button, Icon, Toggle, Tooltip, Dropdown, Excel Exporter Service, CSV Exporter Service | Sorting, Exporting, Filtering, Resizing, Super Compact Mode | For trend analysis, KPIs, and viewing sales summaries by region, product, etc. |
| Fleet Management | Master-Detail Grid, Pie Chart, Category Chart, Geographic Map, Excel Exporter Service, CSV Exporter Service | Sorting, Exporting, Filtering, Column Pinning, Column Hiding | Managing vehicle acquisition operations and maintenance. |
The Detailed Overview
ERP / Inventory
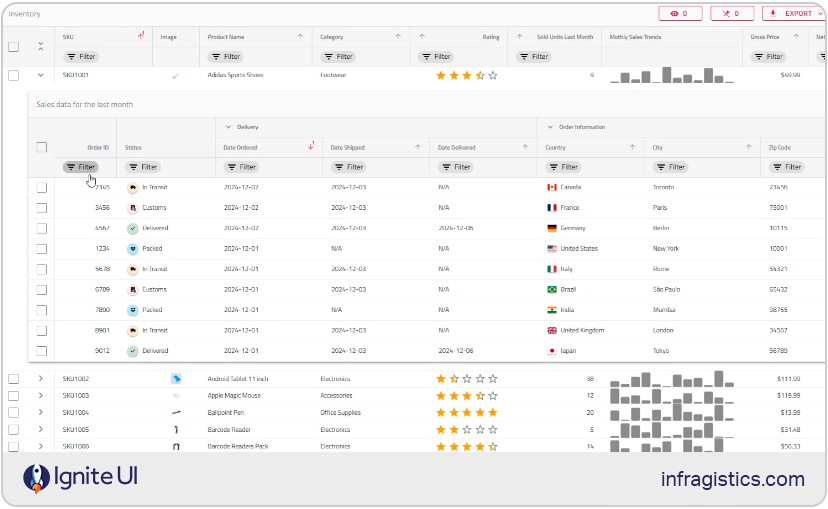
In this React Grid example, the Ignite UI Hierarchical Grid shines for ERP and inventory apps. It can manage huge catalogs with multiple levels of detail (e.g., warehouses → product lines → orders) without performance issues. Businesses benefit from real-time tracking of stock levels, product locations, and order data in a single, scalable interface.
Who can benefit from this app: Retailers and warehouses can benefit from this app when they want to track stock levels, product details, and orders in real time; ERP developers building applications where massive datasets must remain responsive will also find it useful; and operations teams that rely on structured, drill-down views to quickly spot shortages or bottlenecks can also customize and leverage its features.
Components used: Hierarchical Grid, Data Chart, Rating, Dialog, Badge, Button, Icon, Excel Exporter Service, CSV Exporter Service
Features used: Row Selection, Sorting, Filtering, Column Moving, Column Hiding, Column Pinning, Exporting
Download the sample or install the npm package to test Ignite UI for React and go beyond the samples.
Org Chart / HR Portal
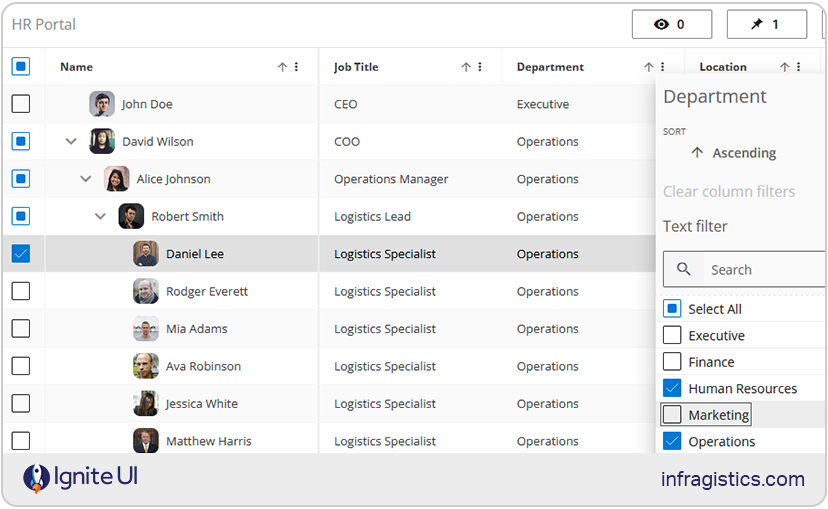
The Tree Grid in Ignite UI for React is ideal for organizational data and HR portals. It makes it easy to visualize hierarchies such as employees, departments, and reporting structures. With filtering, paging, and Excel-style export built in, HR teams get a transparent and efficient way to manage company data while employees benefit from clear org chart navigation.
Who can benefit from this app: It is useful to HR departments that want a clear and interactive way to manage employee data; enterprises needing to visualize reporting structures and maintain transparency; and even team leads and managers who require quick insights into team composition and responsibilities.
Components used: Tree Grid, Avatar, Button, Icon, Paginator, Excel Exporter Service, CSV Exporter Service
Features used: Row Selection, Sorting, Excel Style Filtering, Column Hiding, Column Pinning, Exporting, Paging
Download the sample or install the npm package to test Ignite UI for React and go beyond the samples.
Financial Portfolio App
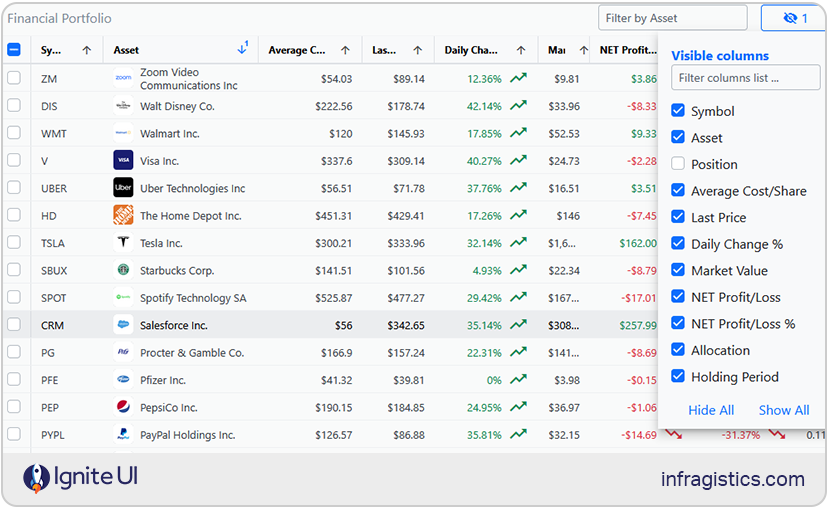
This Financial app integrates our React Data Grid because it combines high-speed rendering with features like conditional cell styling. This allows instant feedback on profit/loss indicators and live updates from market data feeds. When used by portfolio managers, they can sort, filter, and export information seamlessly for deeper offline analysis.
Who can benefit from this app: This React Grid example app is ideal for analysts and advisors tracking portfolios, market movements, and P&L data; investment firms that need Excel-like Grid functionality for client dashboards, and fintech developers creating real-time trading or analytics applications.
Components used: Data Grid, Avatar, Button, Icon, Linear Bar, Input Group, Excel Exporter Service, CSV Exporter Service
Features used: Row Selection, Sorting, Column Hiding, Column Pinning, Exporting, Conditional Cell Styling, Filtering
Download the sample or install the npm package to test Ignite UI for React and go beyond the samples.
Sales Dashboard
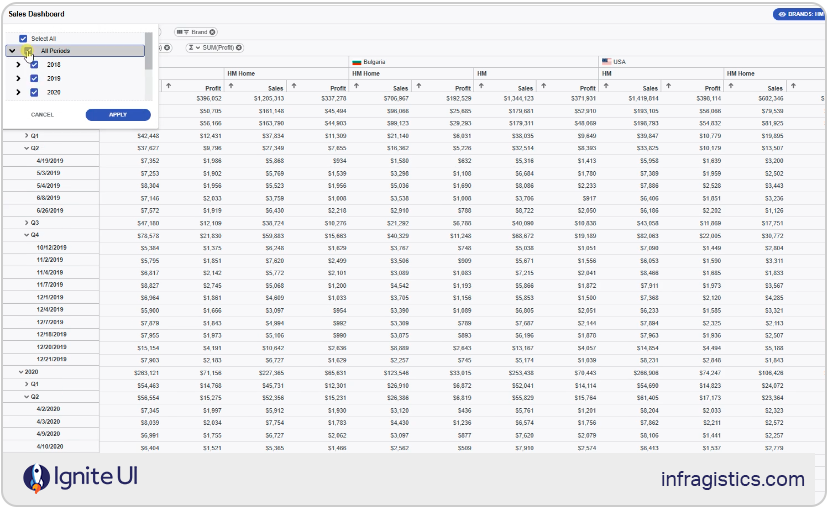
This sales dashboard example leverages Ignite UI for React Pivot Grid which provides powerful data aggregation for sales insights. By slicing metrics by region, product, or time period, teams can uncover patterns and track KPIs at multiple levels of detail. The responsive design ensures sales managers can access dashboards across devices while keeping the experience fast and intuitive.
Who can benefit from this app: Teams looking to monitor KPIs such as revenue, units sold, and regional performance; sales managers and executives needing aggregated, high-level insights with drill-down detail, or business analysts who want to slice and filter sales data by product, geography, or time period.
Components used: Pivot Grid, Pivot Data Selector, Button, Icon, Toggle, Tooltip, Dropdown, Excel Exporter Service, CSV Exporter Service
Features used: Sorting, Exporting, Filtering, Resizing, Super Compact Mode
Download the sample or install the npm package to test Ignite UI for React and go beyond the samples.
Fleet Management System
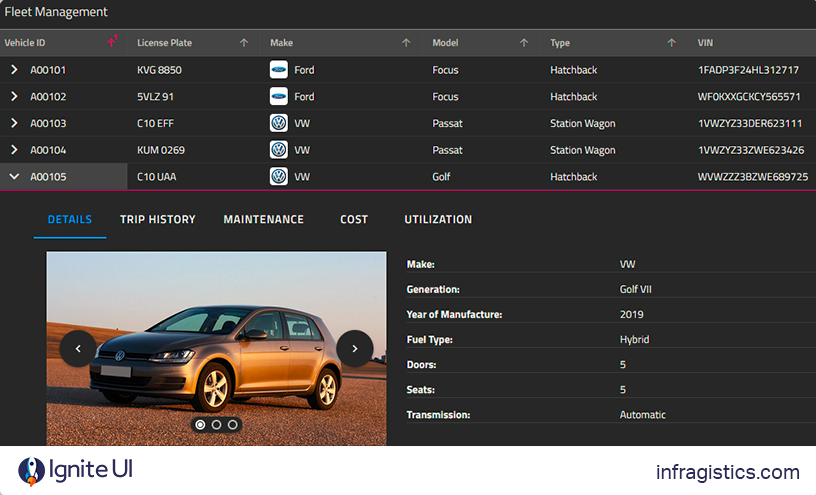
In this Fleet Management System, you can see the use of the Ignite UI for React Grid with a master-detail view for fleet management scenarios. It lets businesses drill into details about each vehicle like engine type, trip history, or maintenance records. And the best part is that all is fit into a single expandable view. Combined with charts and maps, it becomes a great React Grid Layout example, delivering a rich visualization layer for logistics and operations teams.
Who can benefit from this sample app: It is ideal for e-commerce platforms and retail businesses that want to showcase their products in an organized way with the required product-specific information like car engine, maker, fuel type, trip history, maintenance, and more.
Components used: Master-Detail Grid, Pie Chart, Category Chart, Card, Geographic Map, Overlay, Avatar, Badge, Tabs, Carousel, Slide, Divider, Select, Button, Icon, Excel Exporter Service, CSV Exporter Service
Features used: Sorting, Exporting, Filtering, Column Pinning, Column Hiding
Download the sample or install the npm package to test Ignite UI for React and go beyond the samples.
Key Criteria to Select the Best Grid for Your Project
Getting started with grids can sometimes feel overwhelming at first. This is especially true for developers who haven’t worked much with advanced grid features like grouping, filtering, or virtualization. By first understanding the core concepts and use cases of grids, it becomes much easier to evaluate different options and implement the right component for your project.
That’s why before diving into specific libraries, it’s worth considering the key criteria that define an effective Grid. These criteria will help you assess not only performance and features but also how well a React Grid control fits the unique needs and requirements.
Performance
For data-heavy applications like ERP dashboards or sales platforms, performance is the number one consideration. Look for grids that support row and column virtualization, so large datasets can be rendered and interacted with smoothly without feeling too heavy or overwhelming the browser. A good grid should also handle real-time updates efficiently, ensuring your UI remains snappy even as thousands of rows change every second.
Features
Not all projects need pivot tables or Excel-like editing, but most will at least need sorting, filtering, and pagination. Beyond the basics, advanced features such as grouping, aggregation, column pinning, and exporting to Excel/PDF can significantly enhance usability. When comparing one React JS Grid example to another, think about whether you’ll need just the fundamentals or a full-fledged enterprise-grade toolkit.
Customization
Every project has unique UI requirements, so flexibility matters. The best React Grid components allow you to inject custom cell renderers, column templates, and themes. This ensures your grid doesn’t feel like a generic add-on but instead integrates seamlessly into your brand’s design system.
Developer Experience
A grid that’s powerful but painful to configure isn’t worth it. Strong documentation, TypeScript support, and an API that integrates well with popular React tools (such as Redux, Next.js, or Vite) can make or break your developer experience. You should feel confident that new team members can get up to speed quickly without days of setup. Have a look at our documentation, for example, and see how easy it is to set up your grid components. Whatever our development teams build, they build it with the user in mind.
Community and Ecosystem
An active ecosystem means faster troubleshooting and long-term stability. Check whether the React component library providing the grid you need has a vibrant open-source community or if it’s backed up by a dedicated company offering support. Regular updates also indicate that the UI library is keeping pace with the evolution of React.
UI/UX Quality
Grids don’t just display data. They are part of your product’s UX. Make sure the grid is responsive across devices, accessible to screen readers, and visually consistent with your overall design. A grid, like Ignite UI for React Grid, for instance, aligns with UX best practices, can improve adoption, and reduces training needs.
Licensing and Cost
Some React Grid Layout examples are completely open source, while others require a commercial license to unlock enterprise features. Understanding your budget and licensing restrictions early on will help you avoid unexpected costs and issues later. If your project is mission-critical, investing in guaranteed support may be a more effective strategy than relying solely on community contributions.
Use Case Fit
Finally, ask yourself: Does this grid truly fit the problem I’m trying to solve? A lightweight table might be perfect for a prototype but inadequate for a sales dashboard. On the other hand, an enterprise-grade grid could be overkill for a simple KPI layout. Matching the grid’s strengths to your project’s requirements ensures you are not underbuilding or overengineering.
Wrap Up…
Getting started with a feature-packed, data-driven React app can be daunting, and quite often, developers, especially if you are a junior programmer, look for a simpler solution. One way to simplify the development process is by utilizing and customizing a React Grid Layout example. It not only saves you time and effort, but it also allows you to explore the code behind the app, examine the components, and learn from best practices.
Our React developers built the React Grid examples I listed below with the idea to:
- Demonstrate how different Ignite UI for React Grids and other components work together.
- Help teams craft full-featured applications with ease and prototype faster.
- Accelerate the learning curve by enabling them to inspect the source code and try out different layouts.
- Highlight practical implementations of complex features, such as pivoting, exporting, or hierarchical data, without starting from scratch.
- Allow others to use the examples as blueprints, then tweak them to fit unique project requirements.
Together, these React JS Grid example apps serve as both a learning resource and a launchpad, providing developers with the knowledge and tools to build scalable, high-performance React applications with ease.
