
Top 5 React Grid Features for Better UX & Performance
When selecting a React data grid, in addition to performance and price, you should also consider how real users will interact with it and what features you will need to match app requirements and users’ expectations. Features like Advanced Filtering, State Persistence, Keyboard Navigation, and Export to Excel aren't just a necessity.
React is one of the most used web frameworks among developers worldwide for building applications. To date, over 1.3 million websites utilize it, while the number of teams and React programmers leveraging the technology continues to grow exponentially every day. The reason is:
- Its component-based architecture
- Flexibility
- And a rich ecosystem of libraries
All of this makes building interactive user interfaces fast and efficient. One essential UI component that developers often need is the React data grid, which is a robust table-like structure for displaying and manipulating data. To create the best apps with comprehensive grids, however, developers require comprehensive data grid features. But what are the top 5 React Grid features to look for in your React library?
This article will examine Ignite UI for React Grid and provide a list of the best React features and their corresponding use cases. So, here’s the functionality you need.
If you are evaluating options broadly, start with the main React Data Grid pillar page. If you want implementation detail, see the React Data Grid component docs.
Advanced Filtering – For Complex Filter Conditions
We listed Ignite UI for React Advanced Filtering among the best React table features because it provides the ability to create complex filtering queries with different conditions combined using and/or operands.
Once you have created the filtering conditions and groups, all you need to do to filter the data is click the Apply button. If you have modified the advanced filter but don’t want to preserve the changes, click the Cancel button. You could also clear the advanced filter by clicking the Clear Filter button.
Use Cases
- Finding all sales above a certain value that happened in a defined time period.
- A panel that lets users find stocks of a particular product at a specific location.
- A Financial dashboard that filters a large number of transactions.
Here is a short video on how you can filter all dates past a certain point meeting a specific criteria.
How to Enable Advanced Filtering?
If you need Advanced Filtering as one of your React Grid features and want to enable it, the allowAdvancedFiltering input property should be set to true.
<IgrGrid data={nwindData} autoGenerate={false} ref={gridRef} allowAdvancedFiltering={true}>

    <IgrGridToolbar></IgrGridToolbar>

</IgrGrid>
The advanced filtering generates a filteringExpressionsTree, which is stored in the advancedFilteringExpressionsTree input property. You could use the advancedFilteringExpressionsTree property to set an initial state of the advanced filtering.
const filteringTree: IgrFilteringExpressionsTree = {

    operator: FilteringLogic.And,

    filteringOperands: [

        {

            fieldName: "ProductID",

            condition: new IgrNumberFilteringOperand().condition("doesNotEqual"),

            searchVal: 1,

            ignoreCase: true,

        },

        {

            fieldName: "ProductName",

            conditionName: "startsWith",

            searchVal: "Ch",

            ignoreCase: true,

        }

    ]

};

<IgrGrid data={data} allowFiltering={true} advancedFilteringExpressionsTree={filteringTree}>

    <IgrGridToolbar>

        <IgrGridToolbarActions>

            <IgrGridToolbarAdvancedFiltering></IgrGridToolbarAdvancedFiltering>

        </IgrGridToolbarActions>

    </IgrGridToolbar>

    <IgrColumn field="ProductID" filterable={true} dataType="number"></IgrColumn>

    <IgrColumn field="ProductName" dataType="string" filterable={true}></IgrColumn>
State Persistence – Save & Restore Grid Views
Do you want to save and restore the grid state in a simple manner? Use the State Persistence feature in Ignite UI for React Grid. Any change you apply will be saved and restored after the page is reloaded. When the IgrGridState is applied to the React IgrGrid, it exposes the GetState, GetStateAsString, ApplyState, and ApplyStateFromString methods. This helps you achieve state persistence in any scenario. It’s among the top 5 React Grid features because it’s ideal for apps where users require consistency and customization in terms of how data is presented.
Use Cases
- For grid layouts that require customizations by sorting, resizing columns, applying filters, and settings that can be saved automatically.
- A task management app where users want their filtered, customized task view to remain the same after logging in again.
- A finance team reporting dashboard that allows users to save specific column configurations of expense records or a defined budget.
How to Enable State Persistence?
<IgrGrid>

    <IgrGridState ref={gridStateRef}></IgrGridState>

</IgrGrid>

// get an `IgrGridStateInfo` object, containing all features original state objects, as returned by the grid public API

const state: IgrGridStateInfo = gridStateRef.current.getState([]);

// get all features` state in a serialized JSON string

const stateString: string = gridStateRef.current.getStateAsString([]);

// get the sorting and filtering expressions

const sortingFilteringStates: IgrGridStateInfo = gridStateRef.current.getState(['sorting', 'filtering']);
Keyboard Navigation – Shortcuts for Improved Productivity & Accessibility
When it comes to data-heavy React apps, Keyboard Navigation is among the most efficient React grid features because it allows for faster data entry and editing, and is also used for interacting with other grid features.
The React Keyboard Navigation feature provides a rich variety of keyboard interactions for users, including sorting and grouping options. It enhances the accessibility of the Grid and allows for seamless navigation through any type of elements inside (cell, row, column header, toolbar, footer, etc.). In Ignite UI for React Grid, this functionality is enabled by default, and you can override any of the default behaviors in an easy way.
Use Cases
- For a customer support CRM where users need to process tickets fast.
- An accessibility-focused app used by screen reader users who rely on keyboard commands to navigate grid content.
- A spreadsheet-style finance tool where large volumes of data can be added using only the keyboard.
Furthermore, users can override much of the navigation functionality by utilizing the built-in events, allowing them to tailor the experience more closely to their app’s needs.
How to Customize Keyboard Navigation?
<IgrGrid id="grid1" primaryKey="ProductID" onGridKeydown={customKeydown}>

</IgrGrid>

const customKeydown = (eventArgs: IgrGridKeydownEventArgs) => {

  const args = eventArgs.detail;

  const target= args.target;

  const evt = args.event;

  const type = args.targetType;

  if (type === 'dataCell' && target.editMode && evt.key.toLowerCase() === 'tab') {

      // 1. USER INPUT VALIDATION ON TAB

  }

  if (type === 'dataCell' && evt.key.toLowerCase() === 'enter') {

      // 2. CUSTOM NAVIGATION ON ENTER KEY PRESS

  }

}
Export to Excel – Sharing & Analyzing Data
The Export to Excel feature in React Grid lets you quickly export grid data directly to Excel. This format enables React features such as filtering, sorting, and sharing data outside the app. When using Ignite UI for React, the data export functionality is encapsulated in the ExcelExporterService class, and the data is exported in MS Excel table format. If you want to do this, you will have to invoke the Export method of ExcelExporterService and pass the IgrGrid component as the first argument to export the grid easily.
Use Cases
- Sharing task progress across the team or stakeholders in a single click, preserving all filters.
- Preparing a report for a team meeting.
- For a sales dashboard where a manager exports filtered sales data.
How to Export Grid with Frozen Column Headers?
function exportEventFreezeHeaders(args: IgrExporterEventArgs) {

    args.detail.options.freezeHeaders = true;

  }

<IgrGridToolbar>

  <IgrGridToolbarActions>

    <IgrGridToolbarExporter onExportStarted={exportEventFreezeHeaders}></IgrGridToolbarExporter>

  </IgrGridToolbarActions>

</IgrGridToolbar>
Pivot Grid – Simplifying Complex Analysis
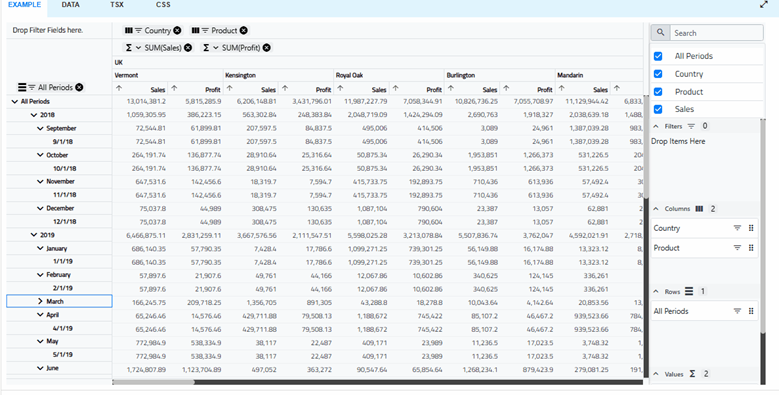
Using Ignite UI for React Pivot Grid enables you to present data in a pivot table, allowing users to perform complex analysis on the supplied dataset. It’s not exactly a feature, but a full component that we built to empower users to organize, summarize, and filter large data volumes, which can be later displayed in a cross-table format. There are key React grid features like row dimensions, column dimensions, aggregations, and filters.
Use Cases
- For a Reveal-style tool, or custom data dashboards for data analysts who require slicing and dicing data directly in the app, without having to export to another tool or write SQL queries.
- A hospital admin dashboard that can configure and display data in a multi-dimensional pivot table structure, analyzing patient records.
- A retail inventory app that pivots stock levels by category, location, etc.
How to Enable Pivot Grid?
Here’s a basic pivot configuration.
const pivotConfiguration1: IgrPivotConfiguration = {

    columns: [

        new IgrPivotDateDimension({

            enabled: true,

            memberName: "Date",

        })

    ],

    rows: [

        {

            enabled: true,

            memberName: "SellerCity"

        },

        {

            enabled: true,

            memberName: "ProductName"

        }

    ],

    filters: [

        {

            enabled: true,

            memberName: "SellerName"

        }

    ],

    values: [

        {

            member: "ProductUnitPrice",

            displayName: "Amount of Sale",

            dataType: "currency",

            enabled: true,

            aggregate: {

                    aggregatorName: "SUM",

                    key: "SUM",

                    label: "Sum of Sale",

                }

        }

    ]

};
This configuration defines 1 row, 1 column, and 1 aggregation that sums the values of each dimension groups. The members match fields available in the provided data source:
public data = [
[
    {
        ProductName: `Clothing`,
        ProductUnitPrice: 12.8,
        SellerName: `Stanley Brooker`,
        SellerCity: `Seattle`,
        Date: `2007-01-01T00:00:00`,
        Value: 94.4,
        NumberOfUnits: 282
    },

];
Wrap Up
When selecting a React data grid, in addition to performance and price, you should also consider how real users will interact with it and what features you will need to match app requirements and users’ expectations. Features like Advanced Filtering, State Persistence, Keyboard Navigation, and Export to Excel aren’t just a necessity.
They ensure better developer productivity, enhanced user experience, customizability, and scalable data management in various scenarios for both simple and complex applications. And when paired with the capabilities of Pivot Grid, all of these empower you to future-proof your apps and maintain clean code so your React projects can evolve with ease.

