Chart provides a sophisticated rendering engine that is accessible through the Layers infrastructure. This topic will provide you with the conceptual background necessary to seamlessly integrate your own custom layers into Chart’s charting framework.
Every chart element displayed by Chart, from axes to text labels, bars to bubbles, and grid lines to tickmarks, is a specialized sub-class of the Primitive type defined within the UltraChart.Core.Primitives namespace. These graphical objects share many of the properties and behaviors used in graphics toolkits (e.g., position, fill color, outline (stroke), opacity (transparency), and hit detection).
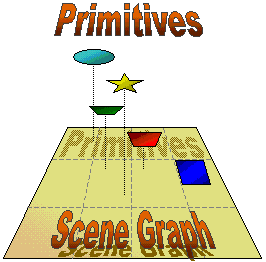
link:Infragistics.win.ultrawinchart~infragistics.ultrachart.core.primitives.primitive.html[Primitives] are added to the Scene Graph, an internal collection object that stores and manages these graphics objects until it is time for them to be rendered. The contents of the scene graph describe the visual objects at the lowest level that end users see as a chart when these Primitives have all been composed into a single scene and rasterized by the renderer.
The illustration above depicts how Primitives are customized and then composited onto a Scene Graph — one on top of the other. Primitives added to the Scene Graph will first appear in the background, covered by any Primitives overlaying them at a later point in processing.
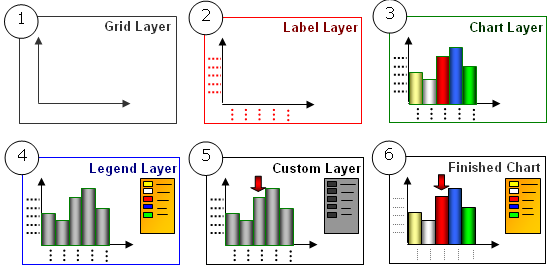
The following figure presents a simplified view of the layering pipeline. In this pipeline, progressively, more complex charts are produced as each layer adds new Primitives of chart elements for which it is responsible. This "divide-and-conquer" model allows many simple layers to collaborate in compositing sophisticated charts.
In the final stage of the figure (step 6), notice how easily a custom layer is inserted to add application-specific features to the chart such as the red selection arrow.You have access to Primitives through a pair of interfaces, each suited to specific kinds of manipulations:
-
High-level — The Chart control exposes a Primitives interface property to application code that allows you to retrieve Primitives related to chart elements. These can then be recolored, resized, examined, and manipulated, and the scene graph can be invalidated and redrawn. The limitation of this interface is that only Primitive objects corresponding to underlying chart data can be retrieved. For example, the bars of a bar chart can be modified, but tickmarks on an axis cannot be modified since they are not directly tied to a piece of data.
-
Low-level — From within the Layer level, you can register your own custom layer implementation that is called back during the rendering process by Chart. Working from inside the pipeline, you have complete control over creating and adding new Primitives anywhere within the chart’s boundaries.