

This topic provides conceptual information about Axis objects used in the UltraDataChart™ control.
The following topics are prerequisites to understanding this topic:
This topic contains the following sections:
In the UltraDataChart control, an Axis provides base properties for specifying appearance of axis main lines, gridlines, tickmarks, titles, stripes, and axis labels. There are several types of axes which are used by different types of Chart Series supported in the chart control. The type of series determines what axes can be used with them. For more information on what axis types are required by a specific series, refer to the Series Requirements topic
All types of axis object in the chart control have set of common properties and the following table list these properties:
The chart control supports various types of axis. These axes are categorized in two groups based on their shape and orientation in the chart plot area. The following table lists these axis groups and all supported types of axis as well as applicable types of series.
Cartesian axes are used only with series that display data points in Cartesian coordinate system. These axes are displayed as horizontal or vertical lines. By default, horizontal and vertical axes are drawn from left to right and from bottom to top, respectively. However, the orientation of axes can be changed in chart control by using the IsInverted property on an individual axis. Perpendicular lines to these axes are called axis major gridlines and they can be spaced evenly by configuring the Interval axis property. Following sections provide descriptions of all Cartesian axes as well as illustrations of how they look with applicable series in the UltraDataChart control.
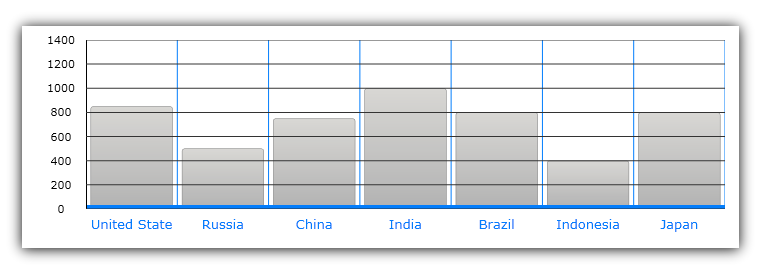
The CategoryXAxis treats the data as a sequence of category data items. Labels on this axis are placed along the X-axis, according to their position in the sequence. This type of axis can display almost any type of data including strings and numbers.
The CategoryYAxis treats the data as a sequence of category data items. Labels on this axis are placed along the Y-axis, according to their position in the sequence. This type of axis can display almost any type of data including strings and numbers.
The CategoryDateTimeXAxis treats the data as a sequence category data items that are sorted by date. Labels on this axis are placed along the X-axis, according to the value in a data column that is mapped using the DateTimeMemberPath property of this axis.
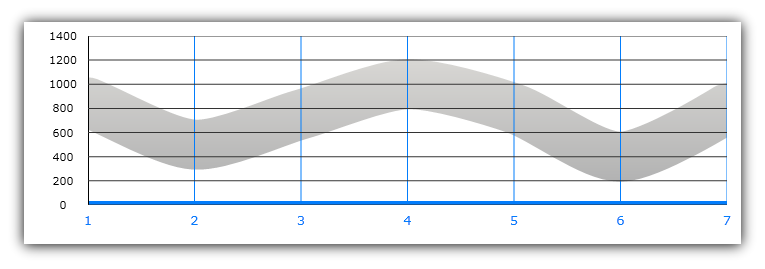
The NumericXAxis treats the data as continuously varying numerical data items. Labels on this axis are placed along the X-axis. Location of labels varies according to the value in a data column that is mapped using the XMemberPath property of Scatter Series or ValueMemberPath property of Bar Series.
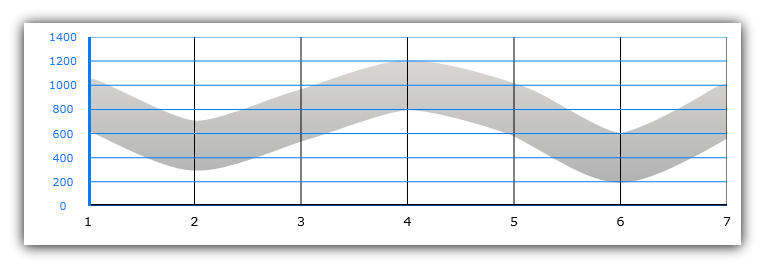
The NumericYAxis treats the data as continuously varying numerical data items. Labels on this axis are placed along the Y-axis. Location of labels varies according to the value in a data column that is mapped using the YMemberPath property for Scatter Series or ValueMemberPath property for Category Series
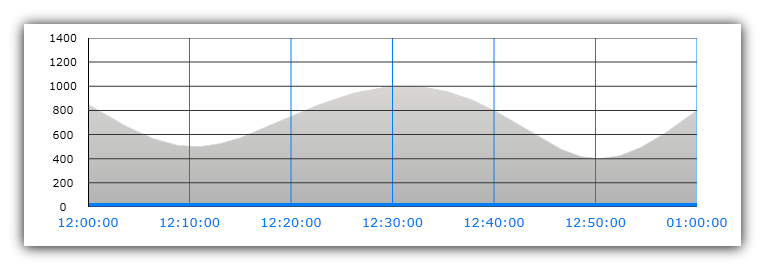
The TimeXAxis treats the data as a sequence of data items, sorted by date. Labels on this axis are dates, and can be formatted and arranged according to date intervals. The date range is determined by the date values in a data column that is mapped using the DateTimeMemberPath property. For details on the TimeXAxis refer to Using Time X-Axis.

Polar axes are used exclusively with Polar Series and Radial Series types and they are displayed as lines along either the radius or the angle coordinates of the chart. The following sections provide descriptions of all polar axes as well as illustrations of how they look with applicable series in the chart control.
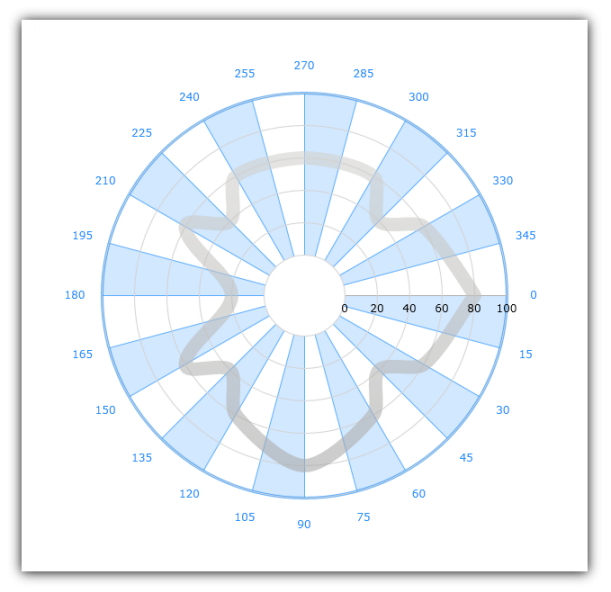
The NumericRadiusAxis treats the data as continuously varying numerical data items. The labels on this axis are placed around a circle. The location of labels varies according to the value in a data column mapped using the AngleMemberPath property of Polar Series object. For details on the NumericAngleAxis, refer to the Using Numeric Radius Axis topic.
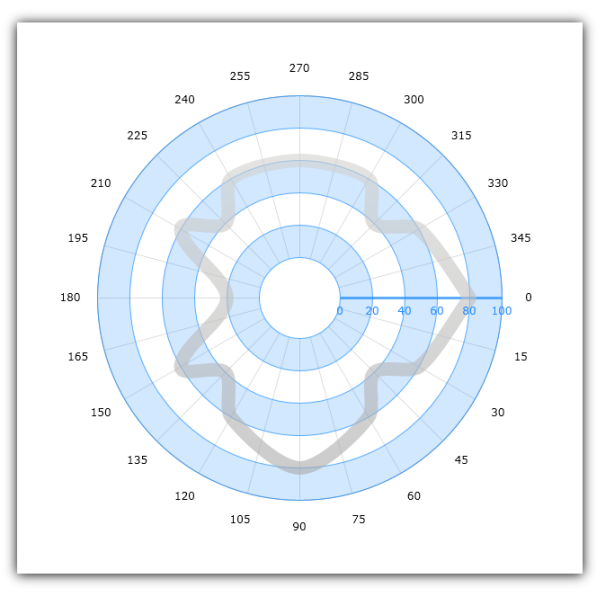
The NumericAngleAxis treats the data as continuously varying numerical data items. The labels on this axis are placed along a radius line starting from the center of circle Location of labels varies according to the value in the data column mapped using the RadiusMemberPath property of the Polar Series object or the ValueMemberPath property of the Radial Series object. For details on NumericRadiusAxis, refer to the Using Numeric Angle Axis topic
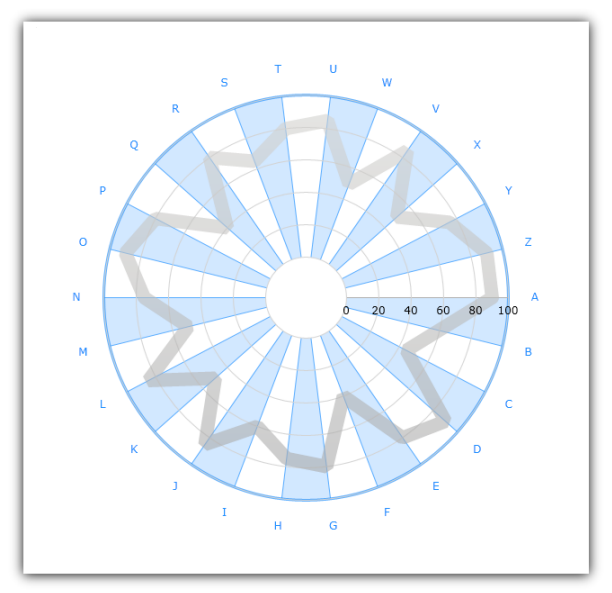
The CategoryAngleAxis treats the data as a sequence of category data items. The labels on this axis are placed along the edge of a circle according to their position in the sequence. This type of axis can display almost any type of data including strings and numbers. For details on the CategoryAngleAxis, refer to the Using Category Angle Axis topic
The following topics provide additional information related to this topic.
ifdef:wpf,win-forms[] * Using Percent Change YAxis * Using Ordinal Time XAxis