
This topic provides detailed overview and instruction on how to create financial overlays in the UltraDataChart™ control.
The following topics are prerequisites to understanding this topic:
This topic contains the following sections:
Financial Overlays are often used by traders to measure changes and to show trends in stock prices. These overlays are usually displayed in front of the Financial Price Series because they share the same Y-Axis scale. In contrast, Financial Indicators do not share the same Y-Axis scale with the FinancialPriceSeries and as result Financial Indicators are usually plotted below or above the FinancialPriceSeries or Financial Overlays. However, the chart control supports plotting both overlays as well as indicators in the same plot area, if desired, using multiple axes or by sharing axes. For more information on this, please refer to Using Multiple Axes and Adding Multiple Series articles.
For more detailed information on financial overlays and indicators, please refer to the following online resources:
All financial overlays require specific data mapping to stock price values (open, high, low, close), and stock volume. The following table lists properties of financial overlays with mappings data columns. You can find an example of financial stock data in the Stocks Price Data source.
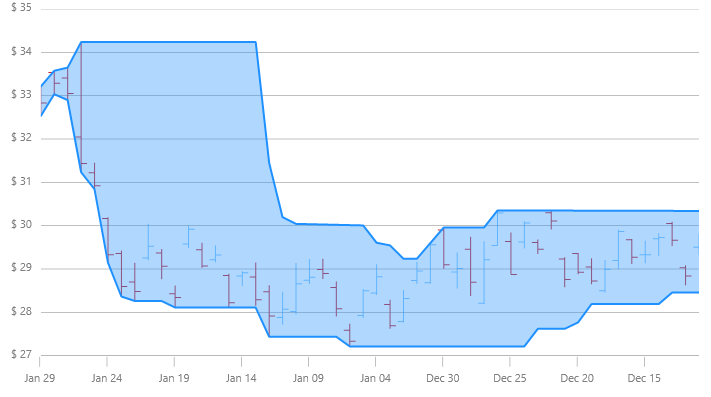
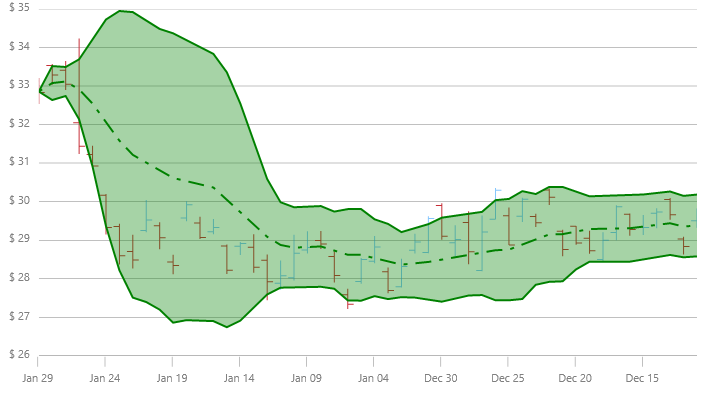
The UltraDataChart control supports over 2 types of financial overlays and the following table provides previews as as well as descriptions of these financial overlays:
The following code snippet shows how to add a BollingerBandsOverlay to the Data Chart control with binding to the Stock Price Data source.
In C#:
var data = new StockPriceData();
var yAxis = new NumericYAxis();
var xAxis = new CategoryXAxis();
xAxis.DataSource = data;
xAxis.Label = "{Date}";
var overlay = new BollingerBandsOverlay();
overlay.DataSource = data;
overlay.OpenMemberPath = "Open";
overlay.HighMemberPath = "High";
overlay.LowMemberPath = "Low";
overlay.CloseMemberPath = "Close";
overlay.VolumeMemberPath = "Volume";
overlay.XAxis = xAxis;
overlay.YAxis = yAxis;
this.DataChart.Axes.Add(xAxis);
this.DataChart.Axes.Add(yAxis);
this.DataChart.Series.Add(overlay);
In Visual Basic:
Dim data As New StockPriceData()
Dim yAxis As New NumericYAxis()
Dim xAxis As New CategoryXAxis()
xAxis.DataSource = data
xAxis.Label = "{Date}"
Dim overlay As New BollingerBandsOverlay()
overlay.DataSource = data
overlay.OpenMemberPath = "Open"
overlay.HighMemberPath = "High"
overlay.LowMemberPath = "Low"
overlay.CloseMemberPath = "Close"
overlay.VolumeMemberPath = "Volume"
overlay.XAxis = xAxis
overlay.YAxis = yAxis
Me.DataChart.Axes.Add(xAxis)
Me.DataChart.Axes.Add(yAxis)
Me.DataChart.Series.Add(overlay)The following topics provide additional information related to this topic.