
This topic provides information on using the XamDataChart™ control’s HighDensityScatterSeries type of series.
The following topics are prerequisites to understanding this topic:
This topic contains the following sections:
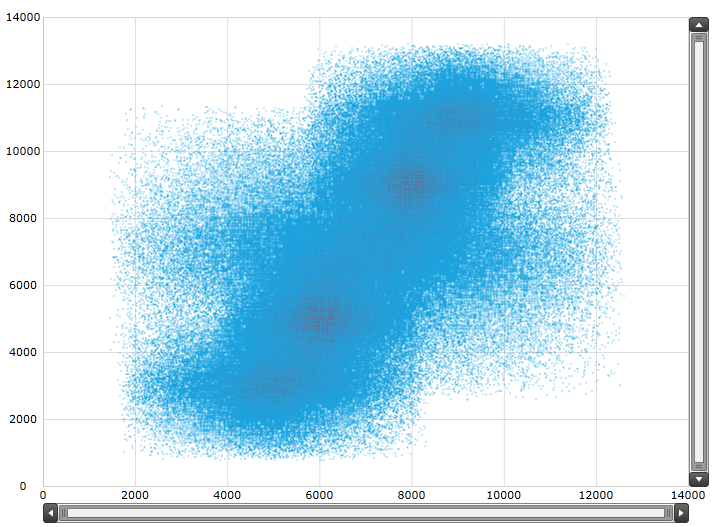
Use the XamDataChart control’s HighDensityScatterSeries series to bind and show scatter data ranging from hundreds to millions of data points with very little loading time. Because there are so many data points, the series displays the scatter data as tiny dots as opposed to full size markers, and displays areas with the most data using a higher color density representing a cluster of data points.
The following screenshot is a preview of the HighDensityScatterSeries series in the XamDataChart control bound to 500,000 data points. The areas colored bright red are the area with the highest concentration of data points.
Similar to other types of scatter series in the XamDataChart control, the HighDensityScatterSeries series has the ItemsSource property for data binding. This property can be bound to objects implementing an IEnumerable interface.
In addition, each item in the items source must have two data columns for X and Y values to position a data point in the Cartesian coordinate system, and uses the XMemberPath and YMemberPath Path properties to map these data columns.
The following table summarizes the HighDensityScatterSeries series properties used for data binding.
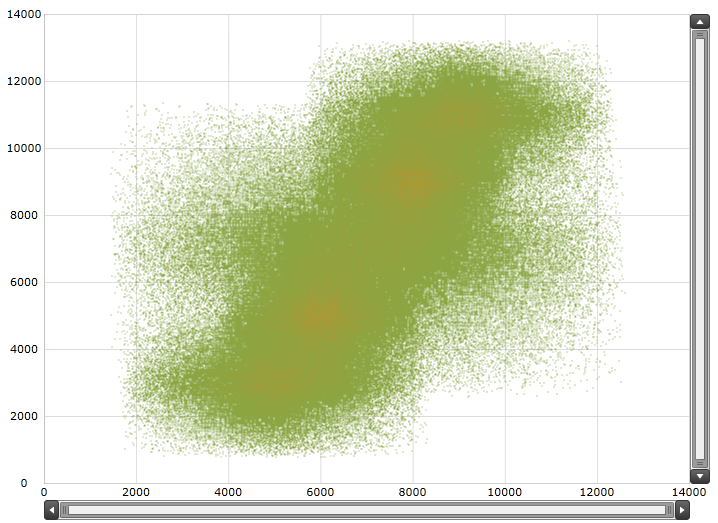
The Heat Color Scale is an optional feature that determines the color pattern within the series. The following table summarizes the properties used for determining the color scale.
The screenshot, following the table, demonstrates how the XamDataChart with the HeatMinimumColor and HeatMaximumColor properties of the HighDensityScatterSeries looks as a result of the following settings:
Following is the code that implements this example:
In XAML:
<ig:XamDataChart.Series>
   <ig:HighDensityScatterSeries
      XAxis="{Binding ElementName=numericXAxis}"
      YAxis="{Binding ElementName=numericYAxis}"
      ItemsSource="{Binding}"
      XMemberPath="XValue"
      YMemberPath="YValue"
      HeatMaximumColor="Orange"
      HeatMinimumColor="Green">
   </ig:HighDensityScatterSeries>
</ig:XamDataChart.Series>The HighDensityScatterSeries series of the XamDataChart is performance optimized. There are many performance specific properties and methods designed to optimize the XamDataChart’s
performance when using hundreds to millions of data points.
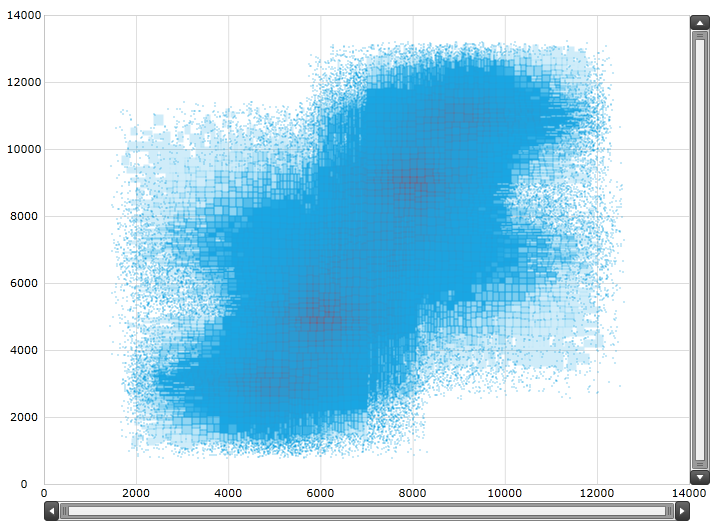
The HighDensityScatterSeries series’ Resolution property determines how aggressively the series consolidates display data. The higher the value, the more aggressively data is merged, and the
greater the performance of the series. While using lower values provide enhanced display resolution, it does so with correspondingly diminished performance.
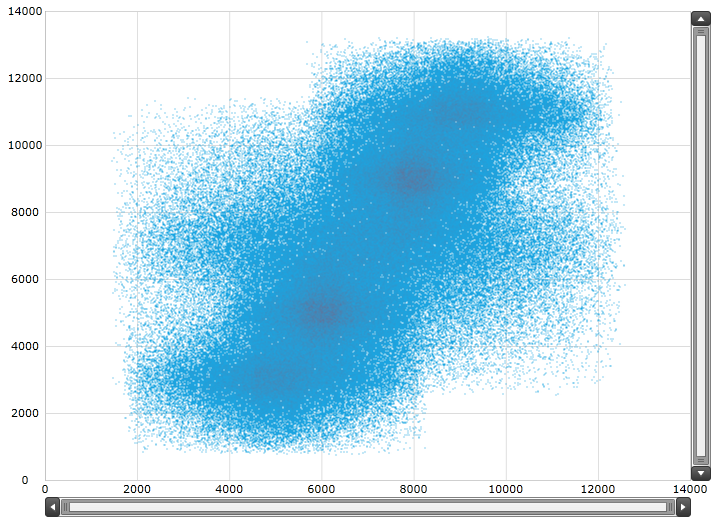
The screenshot, following the table, demonstrates how the XamDataChart renders with the following Resolution property of the HighDensityScatterSeries setting:
Following is the code implemented for this example:
In XAML:
<ig:XamDataChart.Series>
   <ig:HighDensityScatterSeries
      XAxis="{Binding ElementName=numericXAxis}"
      YAxis="{Binding ElementName=numericYAxis}"
      ItemsSource="{Binding}"
      XMemberPath="XValue"
      YMemberPath="YValue"
      Resolution="10">
   </ig:HighDensityScatterSeries>
</ig:XamDataChart.Series>The XamDataChart control progressively renders the HighDensityScatterSeries series loading the data in pieces so that the UI remains responsive for the entire time it takes to load the XamDataChart . By default, the ProgressiveLoad property is set to true. While XamDataChart is rendering, the HighDensityScatterSeries series provides two ways in which you can display the loading status:
Listens for the ProgressiveLoadStatusChanged event allowing the loading status to display
The ProgressiveStatus property represents the progressive load series status with values ranging from 0 to 100; 100 being fully loaded. This property binds to controls that indicate the loading status such as a progress bar.
The screenshot, following this table, illustrates how the XamDataChart renders with the HighDensityScatterSeries series ProgressiveLoadStatusChanged event configured:
The following is the code used to implement the preceding example:
In XAML:
<ig:XamDataChart.Series>
   <ig:HighDensityScatterSeries
      XAxis="{Binding ElementName=numericXAxis}"
      YAxis="{Binding ElementName=numericYAxis}"
      ItemsSource="{Binding}"
      XMemberPath="XValue"
      YMemberPath="YValue"
      Resolution="3"
      ProgressiveLoad="True"
      ProgressiveLoadStatusChanged="OnSeriesProgressiveLoadStatusChanged">
   </ig:HighDensityScatterSeries>
</ig:XamDataChart.Series>
In C#:
private void OnSeriesProgressiveLoadStatusChanged(object sender,
                                   ProgressiveLoadStatusEventArgs e)
{
   this.SeriesLoadingProgressBar.Value = e.CurrentStatus;
   if (e.CurrentStatus == 100)
   {
      SeriesLoadingPanel.Visibility = Visibility.Collapsed;
   }
}
In Visual Basic:
Private Sub OnSeriesProgressiveLoadStatusChanged(ByVal sender As Object, ByVal e As ProgressiveLoadStatusEventArgs) Me.SeriesLoadingProgressBar.Value = e.CurrentStatus If (e.CurrentStatus = 100) Then SeriesLoadingPanel.Visibility = Visibility.Collapsed End IfEnd SubThe HighDensityScatterSeries series’ MouseOverEnabled property specifies whether or not the MouseOver event fires. The default setting for this property is False. The mouse over support for this series can be very expensive in terms of memory and performance. The main disadvantage of setting this value to false is the inability to render Tooltips.
The screenshot, following this table, illustrates the rendering of the XamDataChart with the HighDensityScatterSeries series’ MouseOverEnabled property set as follows, and with a custom ToolTip:
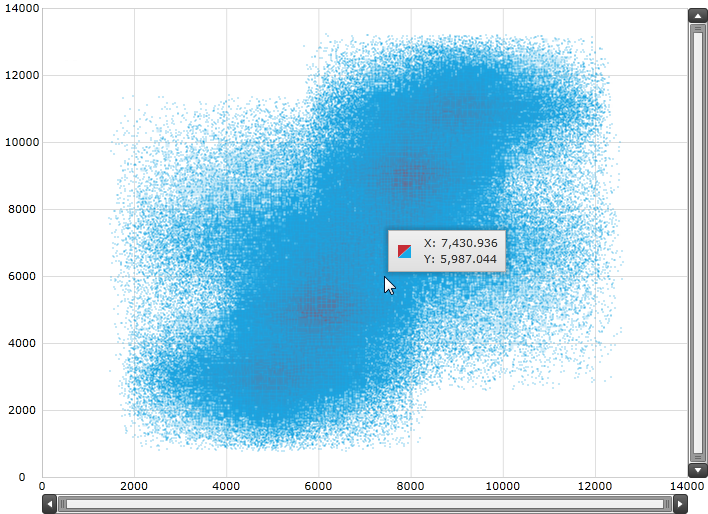
The following is the code used to implement the preceding example:
In XAML:
<ig:XamDataChart.Series>
   <ig:HighDensityScatterSeries
      XAxis="{Binding ElementName=numericXAxis}"
      YAxis="{Binding ElementName=numericYAxis}"
      ItemsSource="{Binding}"
      XMemberPath="XValue"
      YMemberPath="YValue"
      MouseOverEnabled="True"   >
      <ig:HighDensityScatterSeries.ToolTip>
         <StackPanel>
            <StackPanel Orientation="Horizontal">
               <TextBlock Text="X: " />
               <TextBlock Text="{Binding Item.XValue, StringFormat='#,##0.000'}" />
            </StackPanel>
            <StackPanel Orientation="Horizontal">
               <TextBlock Text="Y: " />
               <TextBlock Text="{Binding Item.YValue, StringFormat='#,##0.000'}" />
            </StackPanel>
         </StackPanel>
      </ig:HighDensityScatterSeries.ToolTip>
   </ig:HighDensityScatterSeries>
</ig:XamDataChart.Series>The UseBruteForce property of the HighDensityScatterSeries series determines how the series rendering. When this property is set to true, the series will not build its internal data structures for rendering, but instead renders all the data points every time, thus allowing for quicker initial load time and less memory usage; however, subsequent navigation through the data is significantly slower.
The screenshot following this table illustrates the rendering of the XamDataChart with the HighDensityScatterSeries series’ UseBruteForce property set as follows:
The following is the code used to implement the preceding example:
In XAML:
<ig:XamDataChart.Series>
<ig:HighDensityScatterSeries
XAxis="{Binding ElementName=numericXAxis}"
YAxis="{Binding ElementName=numericYAxis}"
ItemsSource="{Binding}"
XMemberPath="XValue"
YMemberPath="YValue"
ProgressiveLoadStatusChanged="OnSeriesProgressiveLoadStatusChanged"
UseBruteForce="True">
</ig:HighDensityScatterSeries>
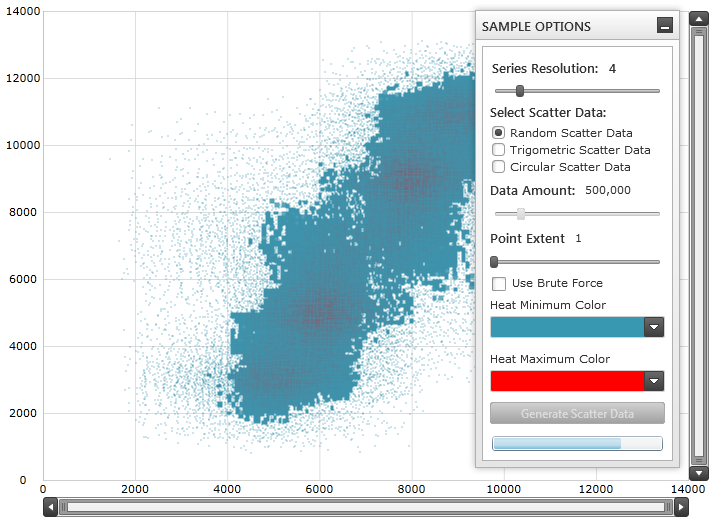
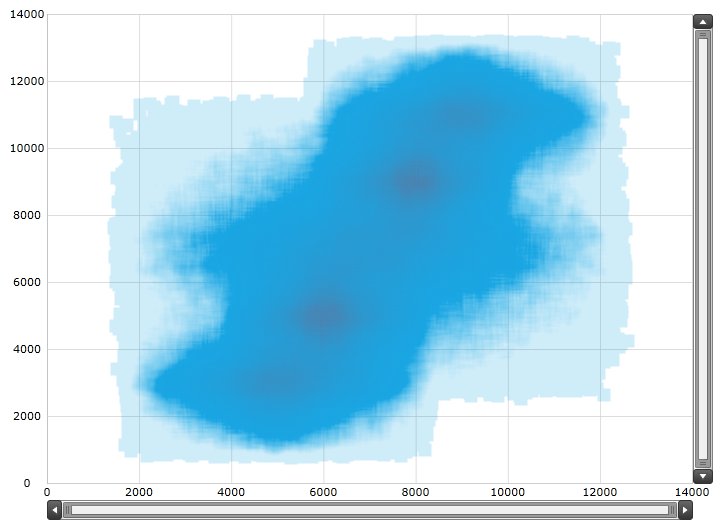
</ig:XamDataChart.Series>The HighDensityScatterSeries series’ PointExtent property raises the minimum point size used for rendering high density scatter series’ points. The point size directly affects the series performance, where the higher the PointExtent property value the lower the performance.
The screenshot, following this table, illustrates how the XamDataChart renders with the HighDensityScatterSeries series’ PointExtent property configured thusly:
The following is the code used to implement the preceding example:
In XAML:
<ig:XamDataChart.Series>
   <ig:HighDensityScatterSeries
      XAxis="{Binding ElementName=numericXAxis}"
      YAxis="{Binding ElementName=numericYAxis}"
      ItemsSource="{Binding}"
      XMemberPath="XValue"
      YMemberPath="YValue"
      PointExtent="7">
   </ig:HighDensityScatterSeries>
</ig:XamDataChart.Series>The following topics provide additional information related to this topic.