
Infragistics Ultimate
Everything You Need To Create Beautiful Applications for Web, Mobile and Desktop
Infragistics Ultimate UI/UX toolkit offers a comprehensive library of enterprise-grade UI controls and includes our low-code WYSIWYG App Builder™ allowing you to build business apps faster than ever before.
What's New in Infragistics Ultimate
Part of our continuous delivery release schedule, the latest update of Infragistics Ultimate is here. It's packed with exciting new features and updates to help your team design and build real apps blazing fast.
- App Builder AI-Powered View Creation Introducing generative AI features for view creation in App Builder, allowing users to generate UI components by entering prompts and refine outputs through iterative actions like adding, replacing, or creating new views.
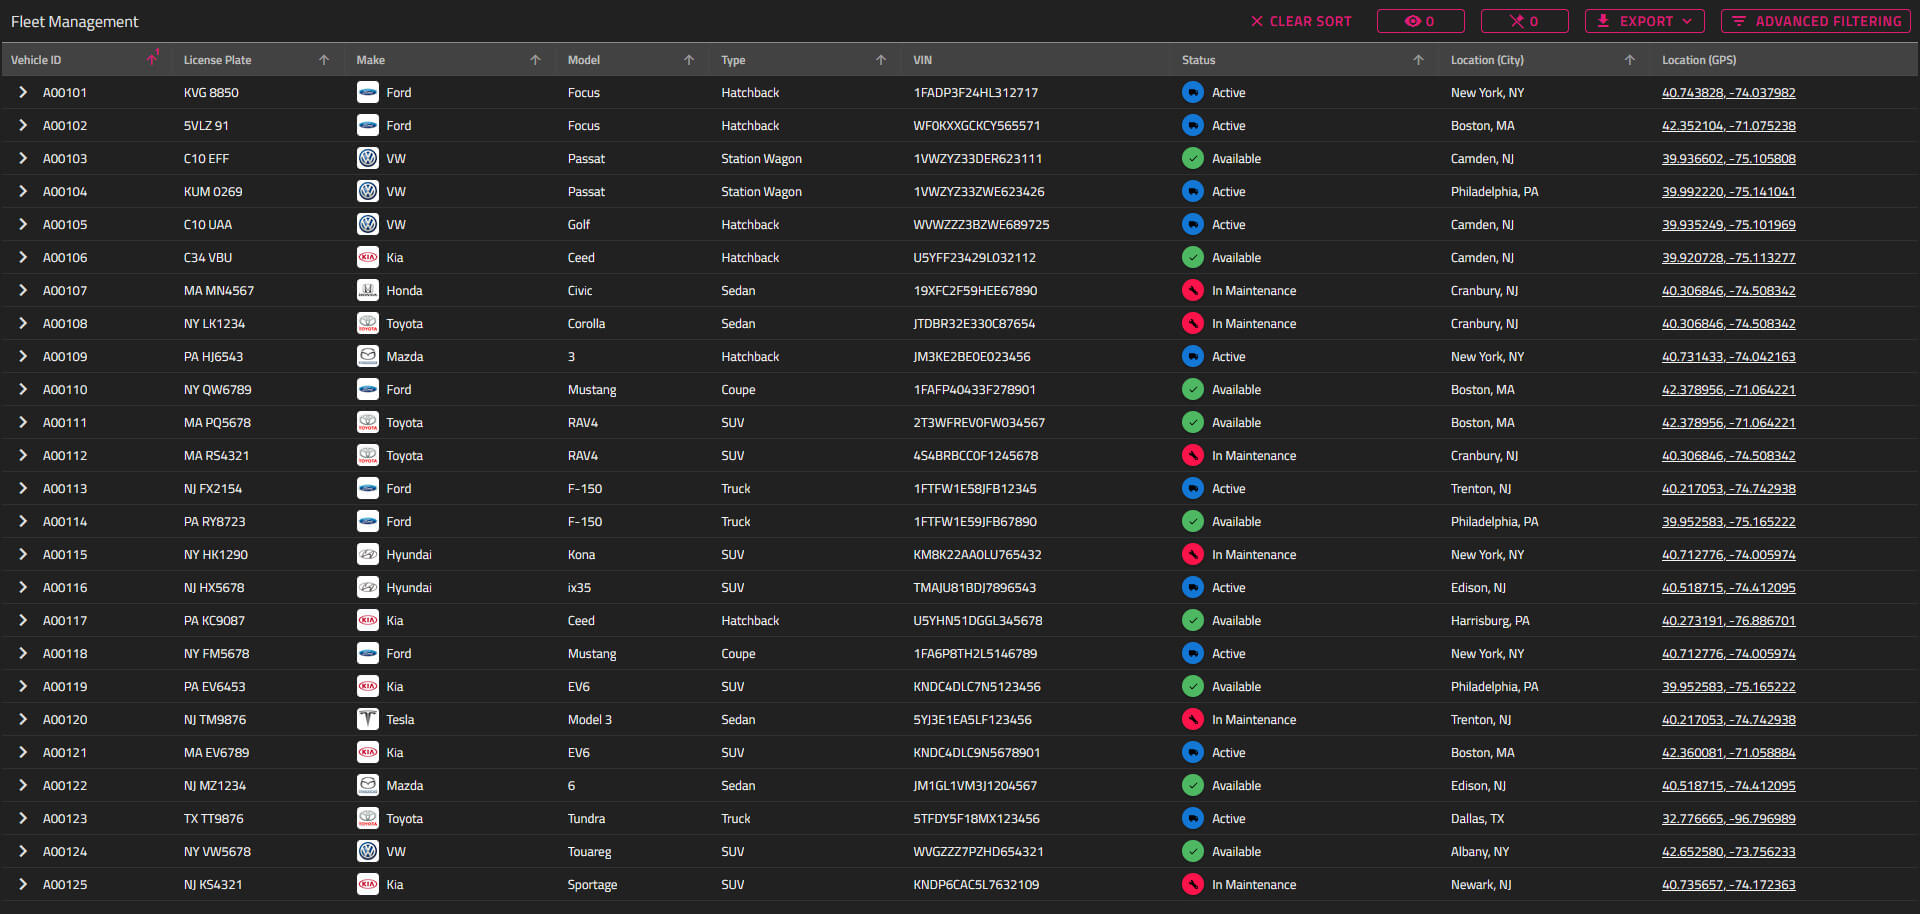
- Angular Query Builder Providing a rich UI that allows developers to build complex data filtering queries for a specified data set. Now with an updated design and several powerful new features such as multi-table query support and others.
- New Dashboard Tile Feature Build interactive dashboards with minimal coding with the new dashboard tile charting feature. Present a dynamic visualization that the end user can alter at runtime via its various toolbar actions.


The Ultimate Developer Toolkit
Design, modernize and transform your next app experience – for any device on any platform.
Design and Build Real Apps Blazing Fast
App Builder is a low-code, cloud-based WYSIWYG drag & drop IDE that eliminates the complexity of user interface design and development so you can build business apps faster than ever. Choose from a library of pre-built app templates or responsive screen layouts or drop in a Sketch or Figma file. Customize with a toolbox of 60+ UI controls and 65+ charts, then generate Angular, Blazor, Web Components, or React code in just a few clicks.
"We wanted to use the same tools and materials in a design that would be used in the development to allow for zero friction in the turnover of design assets. The capability to generate working Angular components with styles was a huge game-changer."

Modern, Responsive Web UX
Infragistics Ultimate comes with the most complete library of enterprise-grade .NET and JavaScript charts, grids and UI components and controls available. Including native libraries for Angular, React, Blazor, Web Components, ASP.NET Core, ASP.NET MVC, jQuery, empowering developers with the tools to create or replicate beautiful experiences in any web framework.
"Even if a company only needs a data grid control, I’d recommend Infragistics because the control is already worth the price of the whole package."

Office-Inspired Desktop Apps
With industry-leading UI toolkits for Windows Forms and WPF, Infragistics Ultimate makes it easy for developers to build beautiful, high-performing modern desktop applications. Included is a complete library of over 100 touch-friendly UI controls & components, including charts, grids, spreadsheets, calendars and more, all built on the latest .NET Core framework from Microsoft.
"We need high-performance controls and components that have been tested and documented. We don't have control developers, so we rely on Infragistics. They are a partner to us, not just a vendor."

Create Better User Experiences
Speed up innovation and time to market with a complete design-to-code system. Indigo.Design is a digital product design platform that integrates UI prototyping, design systems, user testing to eliminate design hand-offs and reduce costly iterations — enabling true UX design-development collaboration.
"There isn't another prototyping tool with this kind of animation capabilities. The best for the money. There is a lot of intuitive features for interactive prototyping, usability testing and collaboration."
Choose the Plan That's Right for You!
Explore our pricing bundles crafted to fit your needs, providing comprehensive solutions for every project size. With user experience 'built-in' to every control and our commitment to a continuous release schedule, you're guaranteed the fastest updates across all major frameworks, ensuring your applications stay cutting-edge.
- Everything in Ignite UI
- Comprehensive UI component library for web, mobile and desktop developers
MULTI-YEAR DISCOUNT
- Everything in Ignite UI and Professional
- UI prototyping, design systems, user testing, app building and code gen
- The only complete UI/UX toolkit for building high performance, modern web, desktop and mobile applications
MULTI-YEAR DISCOUNT
Stories That Truly Matter
More than two million developers use Infragistics UX and UI toolkits to support and accelerate their application development.


Through our partnership with Infragistics and the use of their development tools we have increased our ability to deliver modern applications on premise, in the cloud, and on a diverse set of devices with great user experiences.
Fujitsu
Fujitsu relies on Infragistics Ultimate tools allowing them to save time and money, while delivering a broader set of solutions and UX for their customers. Read More
Beautiful Apps, Source Code Included
No need to reinvent the wheel. Jumpstart your next project with one of our beautifully styled, fully functional reference applications. Download the code and make it your own!
View All Reference Applications
Financial Portfolio App
Representing a real-time portfolio management system, displaying assets, profit and loss analyses, featuring interactive dynamic charts.
Get the App
CRM App
A master-detail style app for managing customer details, inspired by HubSpot. Includes responsive views for Overview dashboard and customer details with multiple tabs.
Get the App
Inventory Management
A reporting dashboard to manage inventory levels and review products in stock. Uses custom side navigation for routing and category charts to report performance.
Get the AppJoin the Conversation
Frequently Asked Questions
Questions and Answers for Infragistics Ultimate
What is Infragistics Ultimate?
Infragistics Ultimate is the only complete UX/UI toolkit and design-to-code solution for desktop, web and mobile app designers and developers. Includes the brand-new cloud-based WYSIWYG drag & drop App Builder, as well as for app design, prototyping, user testing and code generation. Also includes a comprehensive library of user interface (UI) components, including 100s of data charts, grids and controls for desktop (Windows Forms and WPF), web (Angular, ASP.NET (Core & MVC), Blazor, jQuery, React and Web Components) and mobile (Android, iOS and Xamarin).
What makes Infragistics Ultimate different from other UX/UI toolkits?
Infragistics Ultimate is the only solution of its kind, integrating a complete UX/UI toolkit and design-to-code solution for desktop, web and mobile app designers and developers. Including our low code, WYSIWYG App Builder for faster app development. Backed by Infragistics 30+ years of industry leadership and our award-winning live support, Infragistics Ultimate provides you with everything you need to build beautiful experiences in any framework or platform.
How does the pricing and licensing for Infragistics Ultimate work?
Infragistics Ultimate is licensed via a subscription model. A single developer license for the Infragistics Ultimate starts at $2,355 USD for a one-year subscription, including one year of standard support and updates. This is the best value for developers and teams building desktop, web and/or mobile applications, with a focus on user experience (UX). We also offer discounts for multi-year licenses. Please refer to our Pricing page for more information on pricing.
How do I get started with Infragistics Ultimate?
The best place to get started would be our documentation and getting started materials for each of our toolsets.
Where can I find component samples and sample applications?
The team at Infragistics maintains a comprehensive library of code samples which you can access here. We also maintain a library of sample applications, which you can access here.
Does Infragistics Ultimate support accessibility (a11y)?
Each product and each component in the Infragistics Ultimate product family is implemented according to the latest accessibility guidelines and specifications. All components have been tested for usability using OS or Browser provided accessibility technology – screen readers. The team ensures not only that the guidelines are implemented, but also that the actual content delivered to visually impaired or blind people is accessible and user-friendly for them.
Does Infragistics Ultimate support internationalization (i18n)?
Each product in the Infragistics Ultimate product family is built with internationalization in mind. Every product offers internationalization mechanisms specific to the supported framework. Languages supported out of the box are English, Japanese, Korean and Spanish. Ignite UI for jQuery and its derivative products – Ignite UI for MVC and Ignite UI for ASP.NET Core also include out of the box language support for French, German, Russian and Bulgarian.
Is Infragistics Ultimate compatible with .NET 8?
As of the Infragistics Ultimate 21.2 release, all our .NET components and solutions are now .NET 8 compatible.
Connect with Infragistics
Follow Us for the Latest News and Updates