Hi, could you help me with this ?
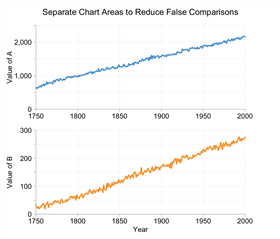
I need to draw 2 or more LineSeries in the same chart, but each line must have its own Y-Axis and all lines must share the same X-Axis.
I need something like this :
Here is my Xaml code which displays 3 lineseries…
is there an easy way in the codehind to acces the Text in the picture that is the category on the X axis of the Olap Axis. in the attached sample it would be the text: Ford, Audi
thanks
Hello,
I am trying to show a StackedColumnSeries which will have in each column the same X number of data to be stacked.
What I want to do is to create dynamically each StackedFragmentSeries depending on the number of the data to be shown. I can't…
How to dispaly dynamically changes Y-Axis values for each request.
For exmaple data:X-axis and Y-axis data for ecach requset. but Y-axis data will change dynamically for each request.
X-Axis -- Y-axiss
------------------------
11/02/2014 2000
12…
So, I have a ScatterLineSeries that I am plotting on a NumericXaxis and NumericYAxis. My data set has a datetime member for the XAxis. What I need to do is be able to plot the data in time order as well as in time order but with equally spaced data values…
Hi,
I need to show live (real-time) data on xamdatachart. The problem is, chart should show data only for 30 seconds (configurable) interval. Since my application would be running for hours (may be 6 or more) so I want to know which approach (adjusting…
I want to be able to set the min and max values for both axis on a XamDataChart and zoom into those values (without redrawing the chart). I do not know if it is even possible.
I was able to get the information from the ViewPort when I do a zoom to…
I have a XamDataChart with Scatter point dynamically generated and Assigned to it.
The problem is that when I zoom into a region or scale the vertical and horizontal axes the chart doesn't show the orginal state when the scale is reset.
They key piece is that: markers must only be shown when all the data points are visible.
There appears to be some hard-coded marker width that determines when to hide the markers. The attached code shows that a skinny line marker gets hidden at the same…
Is any way to make all points at edge fully visible (Picture 1) ?
I've tried to add a Margin to my LineSeries, and that work, but the points are no more aligned with the ticks and Axis lines (Picture 2)
Then adding same margin to axes, but ticks…
I'm showing a chart with 2 LineSeries on it with different amount of points in each series. I'm padding the points in each series with double.NAN to establish the same amount of points in both series (I'm using CategoryDateTimeAxis).
I'm plotting a lot of time data that may have gaps in. Previously, these gaps would have been connected together to form a continuous line. Our customer desires these to be actual gaps where the data is missing. The graphed data is averaged over…
I like the behavior of the default tooltips on the XamDataChart but in some cases I would like to format the number as say currency. I've looked into creating a custom tooltip to handle this but am running into constant grief due to the way our charts…
I'm currently struggeling with the visibility property of a StackedFragmentSeries which is used in a StackedColumnSeries and bound to a dependency-property of the control where the xamDataChart is placed in:
<ig:StackedColumnSeries.Series >…
I am using a XamDataChart in a Silverlight sdk tab control. The chart has a Radial Area series and two Radial Line series. The itemsource and visibility for these are bound to properties in a view model. I also have a Legend on this tab for the chart…
I would like to know if I can to make a dynamically binding behind code for to apply the color of columns in xamdatachart from a property in datasource with the color that it must show.
Thank you.
Hi. I have a chart where I need to add new data points and sometimes modify existing ones. When I replace an existing item in the collection, the change is reflected on the screen. However, the following is not working for me:
- adding a new data point…
I want to set the gaps between the different ColumnSeries,the suggestion in the old issue say that "Thickness='10' Outline='Transparent' Margin='0,0,0,-10' can do this".
But when i have data with the Positive and Negative…
I have been struggling with this from about 2 weeks now. I have a dynamic data set that depending on how the database is queried I will have 1 to n number of groups. Next I take the data and based on the number of buckets (columns) I catagorize the data…
I would not like to display a title and subtitle in my XamDataChart. How can I do this (collapse) so not space allocated for these elements?
Thanks in advance
I am currently using infragstics controls to create a line chart, whereby a user can select from a dropdown list a server to check the CPU performance However, some processes may be run on multiple servers and therefore I would like to dynamically (from…
Hello, I have Silverlight 5 application in which we used Infragistic controls. Now we are converting few views to WPF using MVVM. In xamDataGrid, we make few rows as BOLD based on condition as well as we set background color of few CELLS based on other…
Our team has a hard requirement to support graphing down to the nanosecond resolution. This is not supported by the .NET DateTime struct. We are building a wrapper around the DateTime class to fix the precision problem (PreciseDateTime). Now the only element…
Hi.
I would like to know if have already out of the box soulution for addiding/removing annotations for charts in silverlight like you have in ASP.NETmy app is implemented in Winform and in Silverlight as well.untill now i didnt show the users annotations…
What is the best approach for assigning specific colors to specific XamPieChart slices? For example, the "On Time" slice should always be green, and the "Late" slice should always be red. If I simply declare a BrushCollection…