The NetAdvantage Reporting began as a tool that was meant to overcome limitations – namely, such of existing solutions heavily relying on Windows Forms designer and naturally restricting the area of usability among other things. It became the industry…
This is the second part covering the topic of jQuery Grid checkbox column alternatives and/or custom implementations. A quick recap: the Checkbox column is a feature that provides default setup to turn Boolean values in the jQuery grid into checkboxes…
With the jQuery product Infragistics envisioned business intelligence and data visualization across a range of platforms, not just one – more like every single one of them. Built on popular and largely supported HTML5 and jQuery UI and striving to provide…
The checkbox column (introduced with the last release, see this post on Using Checkbox Columns with the Infragistics jQuery Grid) was created to provide a ‘shortcut’ for transforming columns with Boolean values into checkboxes and mostly became reality…
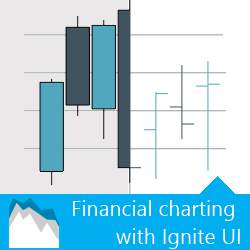
Or should I say “How to deliver charts for Technical analysis” and then throw in a little bit of understanding for a good measure. So, we are technical people, no? Then technical analysis shouldn’t sound so distant? Yeah, well, in the field of…