Exporting a Grid to Excel in Three Simple Steps
In a web application project, exporting a grid to an Excel file is one of the most frequent requirements. There are various ways to do this, but IgniteUI makes it super simple. All it takes is one line of code!
In a web application project, exporting a grid to an Excel file is one of the most frequent requirements. There are various ways to do this, but IgniteUI makes it simple. All it takes is one line of code!
In this post, we will learn to:
- Create a grid
- Export the grid to an Excel file
- Export a grid with features like Pagination enabled to an Excel file
Let’s get started.
Adding References
To work with any IgniteUI control, we first need to add the required JavaScript and CSS references. So, let us start with that. We have three options to add references:
- Download IgniteUI and add the necessary files to the project.
- Use NuGet package in Visual Studio. Right-click on the project and select Manage NuGet package. Search IgniteUI in NuGet Package Manager, and install a trial version of IgniteUI in the project.
- Via CDN: The IgniteUI team provides a public CDN to use.
In this demo, I installed IgniteUI using the NuGet package for the project. We need to add the required references as shown in the listing below:
    <link href="Content/Infragistics/css/themes/infragistics/infragistics.theme.css" rel="stylesheet" />
    <link href="Content/Infragistics/css/structure/infragistics.css" rel="stylesheet" />


    <script src="scripts/jquery-2.0.3.min.js"></script>
    <script src="scripts/jquery-ui-1.10.3.min.js"></script>

    <script src="scripts/Infragistics/js/infragistics.core.js"></script>
    <script src="scripts/Infragistics/js/infragistics.lob.js"></script>

    <script src="scripts/Infragistics/js/modules/infragistics.documents.core.js"></script>
    <script src="scripts/Infragistics/js/modules/infragistics.excel.js"></s cript>
    <script src="scripts/Infragistics/js/modules/infragistics.gridexcelexporter.js"></script>

    <script src="http://www.igniteui.com/js/external/FileSaver.js"></script>
    <script src="http://www.igniteui.com/js/external/Blob.js"></script>

    <script src="demo.js"></script>
Essentially, we are adding references of:
- IgniteUI CSS libraries
- jQuery library
- jQuery UI library
- IgniteUI core, dev, and lob libraries
- IgniteUI libraries for Excel export
Keep in mind that you need to follow the same sequence when adding references, as shown in the above listing. You may notice that I have also added a reference to the demo.js file. As a starter, demo.js contains a function, as shown in the listing below. We will write all the required JavaScript code inside this function.
$(function () {
    //write ignite code here
});
We also have another option to write IgniteUI code inside the jQuery document ready function.
Create HTML
Next, let’s create our HTML page with two elements:
- An HTML table that gets converted to igGrid
- An HTML button that, when clicked, will export the grid to Excel
Let us go ahead and create HTML as shown in the listing below:
<body>
    <table id="grid" ></table>
    <button id="btnExportToExcel" type="button">Export to Excel</button>
</body>
Creating the igGrid
You can create an igGrid by binding data from:
- JSON data from the backend server
- OData EndPoint
- Binding to a local data source. igGrid could be bound to a JSON object array created locally in the application
We have created a JSON object array productData as shown in the listing below:
var productData = [
          { "ProductID": 1, "Name": "Adjustable Race", "ProductNumber": "AR-5381", "SafetyStockLevel": 1000 },
          { "ProductID": 2, "Name": "Bearing Ball", "ProductNumber": "BA-8327", "SafetyStockLevel": 1000 },
          { "ProductID": 3, "Name": "BB Ball Bearing", "ProductNumber": "BE-2349", "SafetyStockLevel": 800 },
          { "ProductID": 4, "Name": "Headset Ball Bearings", "ProductNumber": "BE-2908", "SafetyStockLevel": 800 },
          { "ProductID": 316, "Name": "Blade", "ProductNumber": "BL-2036", "SafetyStockLevel": 800 },
          { "ProductID": 317, "Name": "LL Crankarm", "ProductNumber": "CA-5965", "SafetyStockLevel": 500 },
          { "ProductID": 318, "Name": "ML Crankarm", "ProductNumber": "CA-6738", "SafetyStockLevel": 500 },
          { "ProductID": 319, "Name": "HL Crankarm", "ProductNumber": "CA-7457", "SafetyStockLevel": 500 },
          { "ProductID": 320, "Name": "Chainring Bolts", "ProductNumber": "CB-2903", "SafetyStockLevel": 1000 },
          { "ProductID": 321, "Name": "Chainring Nut", "ProductNumber": "CN-6137", "SafetyStockLevel": 1000 }
    ];
We can bind the above data and create a grid, as shown in the listing below. Essentially, we need to select an HTML table and convert that to igGrid by setting various properties. Keep in mind that to create a minimum grid, we need to put only the data source property. However, here we are setting other properties like columns header, primary key, etc.
So, igGrid can be created as shown in the listing below:
$("#grid").igGrid({
        columns: [
          { key: "ProductID", headerText: "Product ID" },
          { key: "Name", headerText: "Name" },
          { key: "ProductNumber", headerText: "Product number" },
          { key: "SafetyStockLevel", headerText: "Safety stock level" }
        ],
        autoGenerateColumns: false,
        primaryKey: "ProductID",
        dataSource: productData,
        width: "1500px"
    });
You may want to notice the dataSource property in the above listing is set to productData JSON object array. Keep in mind that it can be set to:
- ODATA EndPoint URL
- REST service EndPoint returning JSON data
- Local JOSN data
Regardless of what source type is set to the dataSource property of igGrid, exporting to Excel would be the same. At this point, when running the application, you will find a grid and a button as shown in the image below:
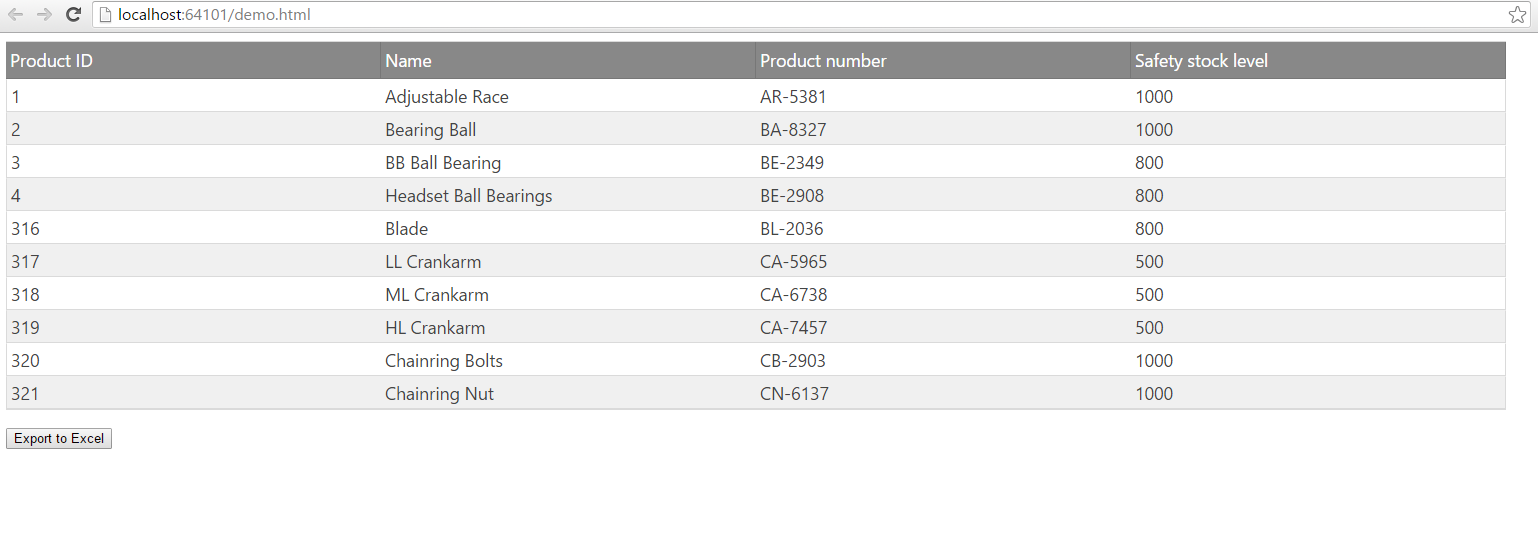
We need to export the grid to Excel at the click of the button.
Exporting igGrid to Excel
Exporting a grid to an Excel file is very simple. IgniteUI has given us a method on ig object called GridExcelExporter.exportGrid. We need to use this method to export a grid to Excel. When clicking the button, the above grid can be exported to Excel, as shown in the listing below.
   $("#btnExportToExcel").click(function () {

        console.log("exporting to Excel");
        $.ig.GridExcelExporter.exportGrid($("#grid"));
    });
As you might have noticed, we are passing the ID of the grid inside the GridExcelExporter.exportGrid method. Right now, the Excel file will be saved with the default name. If we wish to download the Excel file with a desired name, we need to set the filename property value as shown in the listing below.
$("#btnExportToExcel").click(function () {
        console.log("exporting to Excel");

        $.ig.GridExcelExporter.exportGrid($("#grid"), {
            fileName: "yourfilename"
        });
});
Exporting a Grid with Enabled Features
So far, we have exported a simple Grid, but we may have a scenario in which the grid has many features enabled, such as Paging, Sorting, Filtering, etc. GridExcelExporter will default ignore the features and export the whole grid in an Excel file.

Let us say we have features enabled in igGrid as shown in the listing below:
$("#grid").igGrid({
        columns: [
          { key: "ProductID", headerText: "Product ID" },
          { key: "Name", headerText: "Name" },
          { key: "ProductNumber", headerText: "Product number" },
          { key: "SafetyStockLevel", headerText: "Safety stock level" }
        ],
        autoGenerateColumns: false,
        primaryKey: "ProductID",
        dataSource: productData,
        features: [
                  {
                      name: 'Paging',
                      type: "local",
                      pageSize: 2
                  },
                  {
                      name: "Filtering"
                  },
                  {
                      name: "Sorting"
                  }
        ],
        width: "1500px"
    });
We can persist these features while exporting to Excel, as shown in the listing below. Here we are setting gridFeatureOptions properties such as sorting and paging.
   $("#btnExportToExcel").click(function () {
        console.log("exporting to Excel");
        $.ig.GridExcelExporter.exportGrid($("#grid"), {
            fileName: "yourfilename",
            gridFeatureOptions: { "sorting": "applied","paging": "currentPage", "summaries": "applied" },
        });
    });
If we don’t set a value for gridFeatureOptions, by default the Excel file will be exported ignoring the grid features. For example, igGrid will have pagination enabled with 2 records per page and there are a total of 5 pages. If gridFeatureOptions are not set, IgniteUI will export all 10 records in the Excel file.
Conclusion
This post taught us that exporting a Grid to an Excel file using IgniteUI GridExcelExporter is very easy. For reference, let us put every piece of code together.
$(function () {

    var productData = [
         { "ProductID": 1, "Name": "Adjustable Race", "ProductNumber": "AR-5381", "SafetyStockLevel": 1000 },
         { "ProductID": 2, "Name": "Bearing Ball", "ProductNumber": "BA-8327", "SafetyStockLevel": 1000 },
         { "ProductID": 3, "Name": "BB Ball Bearing", "ProductNumber": "BE-2349", "SafetyStockLevel": 800 },
         { "ProductID": 4, "Name": "Headset Ball Bearings", "ProductNumber": "BE-2908", "SafetyStockLevel": 800 },
         { "ProductID": 316, "Name": "Blade", "ProductNumber": "BL-2036", "SafetyStockLevel": 800 },
         { "ProductID": 317, "Name": "LL Crankarm", "ProductNumber": "CA-5965", "SafetyStockLevel": 500 },
         { "ProductID": 318, "Name": "ML Crankarm", "ProductNumber": "CA-6738", "SafetyStockLevel": 500 },
         { "ProductID": 319, "Name": "HL Crankarm", "ProductNumber": "CA-7457", "SafetyStockLevel": 500 },
         { "ProductID": 320, "Name": "Chainring Bolts", "ProductNumber": "CB-2903", "SafetyStockLevel": 1000 },
         { "ProductID": 321, "Name": "Chainring Nut", "ProductNumber": "CN-6137", "SafetyStockLevel": 1000 }
    ];

// Creating GRID
    $("#grid").igGrid({
        columns: [
          { key: "ProductID", headerText: "Product ID" },
          { key: "Name", headerText: "Name" },
          { key: "ProductNumber", headerText: "Product number" },
          { key: "SafetyStockLevel", headerText: "Safety stock level" }
        ],
        autoGenerateColumns: false,
        primaryKey: "ProductID",
        dataSource: productData,
        features: [
                  {
                      name: 'Paging',
                      type: "local",
                      pageSize: 2
                  },
                  {
                      name: "Filtering"
                  },
                  {
                      name: "Sorting"
                  }
        ],
        width: "1500px"
    });


    // Exporting to Excel
    $("#btnExportToExcel").click(function () {
        console.log("exporting to Excel");
        $.ig.GridExcelExporter.exportGrid($("#grid"), {
            fileName: "yourfilename",
            gridFeatureOptions: { "sorting": "applied","paging": "currentPage", "summaries": "applied" },
        });
    });

});
I hope you find this post useful! Keep an eye on future posts where we will cover other IgniteUI controls and their features. Thanks for reading.