It’s DevWeek! The London Barbican Centre hosts the UK’s largest developer conference. Close to 600 developers are here - and so are we. Infragistics is represented with a booth and we’ve had a lot of interesting conversations already.…
On 19 November, 2015 I spoke at the Innovations in Software Technologies and Automation (ISTA) conference in Sofia, Bulgaria. My presentation, “Design, Usability and Complex Systems”, centered on the notion that people (developers, business owners, the…
As a visual designer at Infragistics I am always keeping my eyes open for effective dashboard designs to lend inspiration to projects. By browsing design-rich websites like Pinterest, Behance, or Dribbble I easily find collections that stimulate me. Many…
Visualizing data instead of presenting them as ASCII in lists or tables makes sense because we’re much better in processing graphical than numerical data (the so-called pictorial superiority effect). Also, graphical visualizations are considered to be…
As Infragistics’ user experience consulting group here in Cranbury, the UX work that we do for our clients doesn’t always get the recognition it deserves. While our efforts positively affect the working lives of thousands of individuals across all…
Recently, TIME magazine published this info graphic about top-earning movies. It’s kinda interesting. I spent much more time looking at this than I normally would have. So by that definition, the graphic already reached its goal of engaging its audience…
The New York Times does a great job using interactive graphics to tell a story. Recently the New York Times reported on the details of the United States 2011 budget proposal and how the projected budget deficits may affect US policies and power in the upcoming…
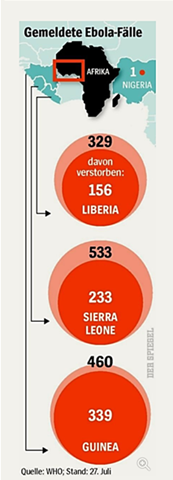
Here’s a cool data viz story. A large weekly magazine in Europe has recently published some statistics about Ebola cases in four African countries. It’s in German, but bear with me here.
Per country, the outer bubble depicts the number of…
Last month at the Human-Computer Interaction International conference in Orlando, I came across some interesting research results. The be honest, the only reason why I paid attention to those was that the they were authored by a Fraunhofer Institute.…
In one of the recent editions, Time magazine featured this graphic:
The underlying data set is pretty simple. It consists of just 8 numbers which are used for four target/actual comparisons: how many swine flu vaccinations 4 organizations have requested…
On October 23-24, 2015 I’ve been invited to speak at the User Centered Design (UCD) conference held annually in London. This is a more interesting conference than most (to me) because the talks center around the disruptive and transformative power…
I am currently finishing up working on a book with a few other Infragistics coworkers (and one other person outside of Infragistics) about designing and implementing Enterprise Dashboards using Silverlight. The book is due out in September, but it is…
One of the trends in UI design is data visualization. With data volume and complexity continuously rising, data visualization becomes more and more important as a means to translate data into information and further information into knowledge. Edward…
The underlying data set is pretty simple. It consists of just 8 numbers which are used for four target/actual comparisons: how many swine flu vaccinations 4 organizations have requested and how many they actually received. And still, the way the data…
As I wrote in an earlier blog, the Infragistics’ UX team was named a 2017 Interaction Design Association’s (IxDA) international awards competition finalist. It was a great honor to have been selected by the judges for our redesign of the complex…
We had a great turnout for the webinar on Dashboard design, thank you for joining! There were so many great questions and comments about User Experience and Design that we could not cover them all during Q&A. Because of this, I’ll address some more here…
There is a lot of data out there today. Spreadsheets upon spreadsheets of data. Presenting this in a meaningful form has, until recently, been the domain of bar charts and line graphs (think MS Excel). This wasn’t necessarily a good thing but at least…
On the 7th - 9th of June, I was lucky enough to have been invited to speak at UX Scotland in Endinburgh. UX Scotland is the annual hands-on, practical UX and design conference for the UX, Service Design and Digital Communities in Scotland and the north…
As news outlets become more and more web centric, we see interactive graphics becoming more useful. The upcoming 2012 Presidential election has provided some interesting graphics, and here is a list of my top 5.