

 Graham Murray
We’re releasing Infragistics Ultimate UI for Uno Platform in beta. Bring compelling, interactive charts, a feature-rich DataGrid, maps, gauges, and dashboards into your Uno Platform applications.
Start your Infragistics Ultimate trial and explore what a shared component collection can bring to your application.
The capability we present here goes beyond putting a chart on another operating system. You can build the right visualization experience around shared C# and XAML, then carry its features and interaction rules across all the platforms your users need. Build it once, and it works consistently and beautifully on all platforms:
-
A data grid can keep the same sorting and formatting rules.
-
A chart can offer the same ways to explore your data.
-
A dashboard can expose a familiar set of commands wherever the application runs.
For teams building business applications, that means more of the investment in the UI can travel with the application: its visual language, data presentation, customization, and the workflows that supercharge your business.

Here we show multiple types of series plotted together with independent value scales. Captured from the Infragistics Ultimate UI for Uno Platform composite-chart sample.
One application experience across Uno Platform targets
Uno Platform brings C# and XAML applications to Windows, macOS, Linux, WebAssembly, iOS, and Android. That reach lets a team serve desktop analysts, browser-based reporting users, and people working on phones or tablets with one beautiful user experience. See Uno Platform’s supported platforms for the framework’s target details.

Carry the shared component model and business rules across platforms while adapting the layout to each device.
Infragistics Ultimate UI for Uno Platform uses Uno Platform’s Skia rendering path. A common rendering foundation supports a coordinated visual experience across platforms, rather than leaving each operating system to draw a different version of the data interface. Uno Platform’s Skia renderer documentation explains that shared rendering model.
The practical goal is consistent component behavior with a layout that suits the device:
-
A desktop screen may show a chart, grid, and settings panel together.
-
A phone may present those views one at a time.
The application can adapt the arrangement of the controls while retaining the same business rules and user experience.
Reuse more than the screen layout
A shared interface lets developers reuse the work behind the screen: data bindings, view models, templates, command handling, chart configuration, and presentation rules. A team can define how a data record is edited or how a visualization is configured in the shared application instead of maintaining a different implementation for each target.
Consider a field-service application:
-
An operations team investigates trends and exceptions on a desktop.
-
A technician opens the relevant records on a tablet.
-
A manager reviews the same measures in a browser.
Each experience can use the same definitions of a status, a target, and a selected data record while presenting the right amount of information for the person and device.
This also makes changes easier to implement. When the team adds a measure, improves a template, or changes a business rule in shared code, these changes can be kept entirely consistent since there is one source of truth for how they are handled and presented.
Make testing, training, and support more reusable
Consistent behavior gives quality assurance teams a common set of scenarios to exercise: apply a filter, verify the resulting rows, check a summary, edit a value, and inspect the corresponding chart. Expected business results and much of the test logic can be reused across target environments.
The same principle helps after deployment. Training can explain one workflow, and support teams can discuss the same controls and commands with users on different platforms. A person moving from a browser to a desktop application has less to relearn.
High-performance charts that are simple to use and deeply customizable
The beta includes both CategoryChart and DataChart. CategoryChart is a convenient starting point for turning bound business data into a visualization. DataChart gives developers explicit control over axes, series, and layers for more specialized analytical views. These components share the core charting engine that Infragistics has been testing and refining for more than 15 years. Bring that experience to demanding analytical views, with detailed control over how data is presented and explored.
Across DataChart and the wider visualization collection, Infragistics Ultimate UI for Uno Platform offers 60+ chart and visualization types, plus 30+ built-in financial indicators. That breadth gives a team room to choose a view specifically tailored to fit the business task at hand.
| Family | A few of the available views |
|---|---|
| Category and trend | Line, area, column, bar, point, spline, spline area, step line, step area, and waterfall. |
| Range | Range area, range bar, and range column for intervals between low and high values. |
| Stacked | Area, bar, column, line, spline, and spline area, with both absolute and 100% stacked presentations. |
| Scatter, bubble, and shape | Scatter points, lines and splines; bubbles; contours; polylines and polygons. |
| Radial | Radial column, pie, area, and line series with categories around an angular axis. |
| Polar | Polar scatter, line, area, spline, and spline area with numeric angle and radius values. |
| Financial | Candlestick and OHLC price displays, financial overlays, and technical indicators. |
| Vertical | Vertical line, area, point, spline, spline area, step line, step area, and waterfall series. |
| Flow | Sankey and radial Sankey series for connected quantities. |
| More visualizations | Pie and doughnut charts, funnels, treemaps, geographic series, sparklines, and gauges. |
Plot category-based data with ease
Category and range series cover comparisons, trends, and intervals. Use columns or bars to compare amounts, lines and splines to follow a trend, range series to show a span, and waterfall series to explain how successive changes build a result. The composite chart at the start of this post combines two column series with a percentage area series and separate value scales.

CategoryChart automatically creates a multi-series trend from bound data. The sample compares Europe, China, and America on a shared scale.
Show the whole and its contributions with stacked series
Stacked series keep individual contributions visible while showing how they build a total. A stacked column can compare a region’s contribution with the complete result; a stacked area can show how that composition changes over time. Bar, line, spline, and spline-area variants let teams choose a presentation that fits the data.

Absolute stacks show both the size of the total and the contributions within it. This sample combines five regional series.
100% stacked series normalize each category to a common total, making the mix easier to compare when the underlying amounts differ.

Every column represents 100%. Desktop, mobile, and tablet shares reveal how the mix differs across the sample categories.
Compare profiles with radial series
Radial series arrange categories around a circle and arrange their values outward from the center. Radial columns keep the categories visually distinct; radial lines and areas reveal the overall shape of a profile. Radial pie series provide another circular presentation within DataChart.

Radial columns make category-by-category differences visible around an angular axis. The example uses illustrative player-profile scores.

The same values become two outlined profiles with translucent areas. Their shapes make strengths and differences easier to scan.
Plot direction and magnitude with polar series
Polar series use numeric values for both angle and radius. That makes them useful for directional measurements, sensor readings, trajectories, or relationships tied to an angle. Choose points, lines, areas, splines, or spline areas to suit the pattern being investigated.

Two polar spline series compare the sample’s wind and boat speeds by direction. The angular position and distance from the center both carry numeric meaning.
Add analytical context to financial prices
Financial price series render open, high, low, and close values as candlesticks or OHLC bars. Add a Bollinger Bands overlay to place a moving average and its surrounding bands beside the prices, or a Price Channel overlay to show a high/low envelope.

The price sample combines candlesticks with a 20-period Bollinger Bands overlay and a multiplier of two. The band stays behind the candles so both remain readable. Data is illustrative.
There are more than 30 built-in technical indicators that extend the view into momentum, volatility, price, and volume analysis. Examples include Relative Strength Index, Moving Average Convergence/Divergence, Average True Range, and stochastic oscillators. Developers can compose the price, overlay, and indicator series around the analysis their application needs.
Make events and regions part of the chart
Annotation layers connect an explanation directly to the data. Data-bound band, line, rectangle, slice, and strip layers can mark an event, interval, reference, or region. Their positions can come from application data, keeping the explanation tied to the chart’s axes as the view changes.

The dotted rectangle marks a region bounded by both an interval on the horizontal axis and a range on the vertical axis. It is a DataAnnotationRectLayer within the chart.
CalloutLayer labels points of interest, CrosshairLayer connects pointer position with reference lines and axis values, and FinalValueLayer keeps the latest result visible beside the scale.

Four callouts identify values from the plotted series. The crosshair shows the value at the pointer position, while the latest-value annotation remains visible on the axis.
Focus attention without losing the context
Hover highlighting makes an item or series stand out while the surrounding data provides context. Applications can configure the behavior around the item under the pointer, nearby items, or the series as a whole.
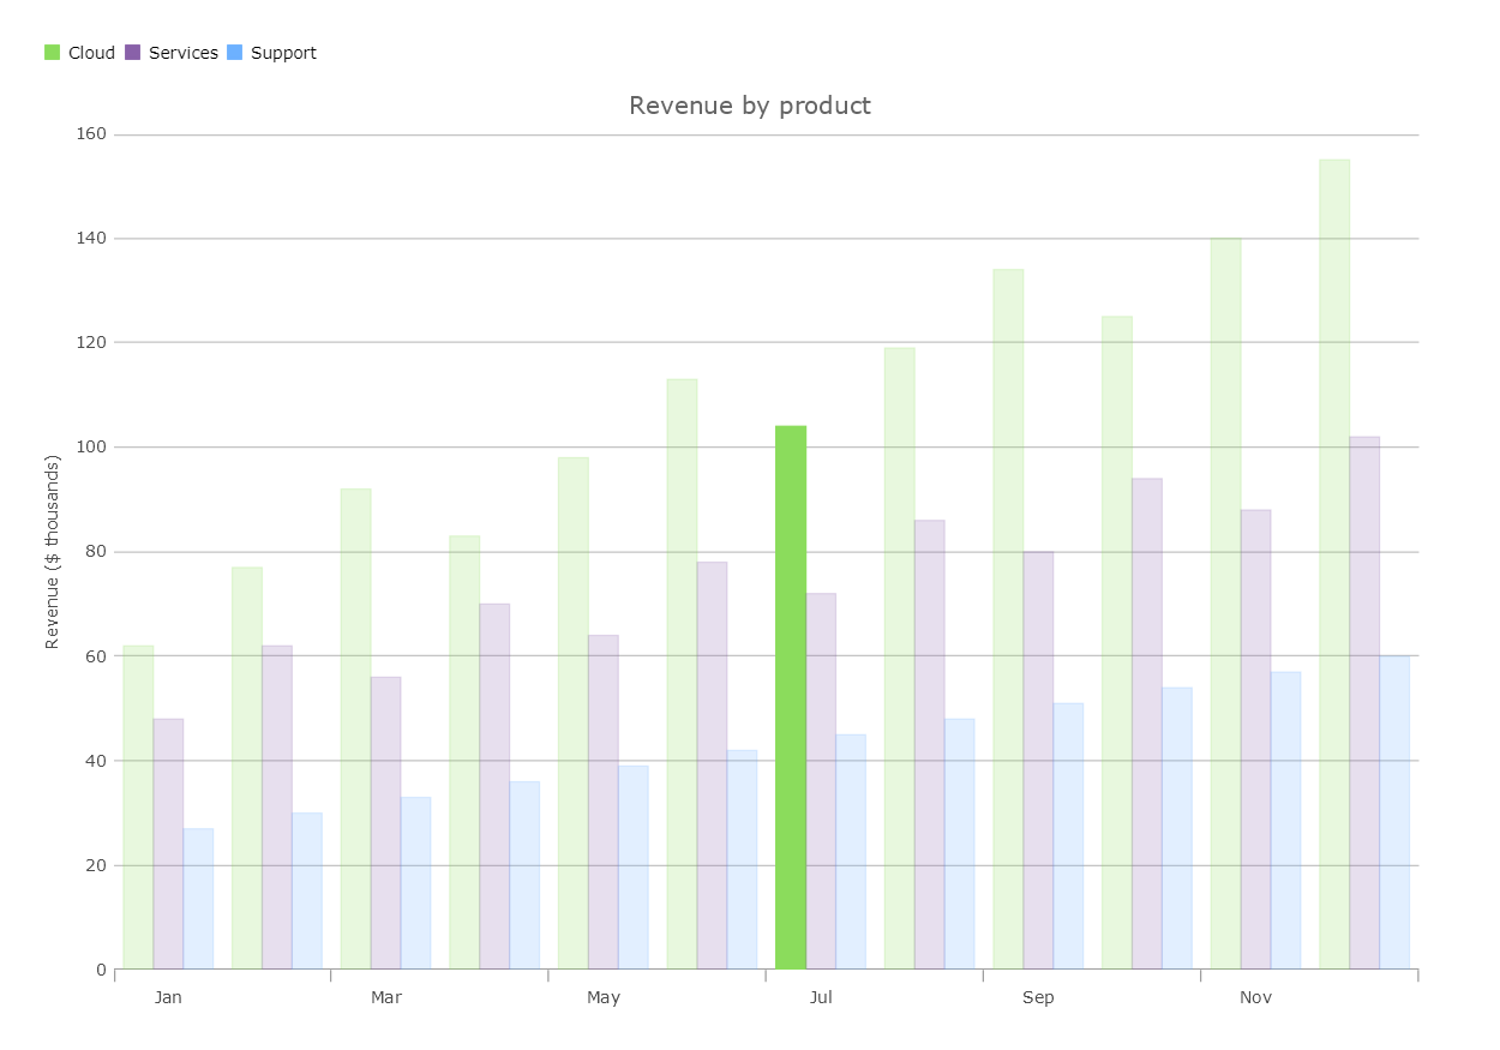
A pointer over the July Cloud column keeps that item vivid and fades its neighbors. The underlying values and scale stay in place.
Highlighted data serves a different purpose: it lets an application provide a highlighted set of values alongside the complete data. A dashboard can show the contribution of a filtered group while retaining the full totals for comparison.

Solid portions show the highlighted values while translucent columns preserve the complete values. The highlighted set can change as users refine a selection elsewhere in an application.
Bring values and interaction details together
Zooming, panning, and selection help users move from an overview to the detail that matters. DataLegend supplies coordinated, dynamic value detail, with grouping and summaries that make multi-series views easier to read.
Use Legend, ItemLegend, and ScaleLegend to explain series, individual items, and value scales, with FinancialLegend available for financial-series detail. Custom XAML tooltip templates and template selectors can bring application-specific fields into the hover interactions. Marker and legend customization give teams another way to carry their domain’s visual language into a chart.

DataLegend brings related series values together and summarizes them for the selected position in the chart.
Bubble charts are a useful example of why attention to detail in interaction behavior matters. Infragistics has over 15 years of fixing tiny behavioral edge cases in our shared charting core, like hovering nested bubbles (as shown below), and you benefit from this attention to detail and commitment to performance when you use our components.

Turn the category sequence vertically
Vertical series offer another way to tailor a visualization to the story you are trying to tell. Put the category sequence down the screen for profiles, stages, well logs, or comparisons that are easier to read vertically.
Vertical series provide more room for labels without needing to angle them, improving the accessibility of the visualization.

A vertical composite view combines bars and a target line while keeping the regional sequence easy to scan.
Follow the flow with Sankey and radial Sankey diagrams
Some questions are about movement between stages: where a budget goes, how resources are allocated, or how a total divides into several outcomes. Sankey series turn those relationships into connected ribbons whose widths communicate their relative size.

Follow a monthly budget through needs, wants, and savings into the individual allocations. The labels keep each contribution connected to its value.

Radial Sankey series arrange the flow around a circle. The different layout can give a budget or allocation story a compact visual focus while retaining the relationships between its parts.

The radial Sankey sample places income sources and allocations around one circular view, with labels and leader lines identifying each stage.

A blisteringly fast DataGrid for working with your data
An analytical application needs a way to work with the records behind the visuals. DataGrid brings high performance virtualized data presentation together with sorting, filtering, grouping, summaries, selection, and editing.
Configure columns around your data with built-in types for text, numbers, dates, images, checkboxes, choices, and hyperlinks, plus custom templates for richer content. A useful grid can combine a person’s photo, business fields, an inline visual comparison, and totals in the same view.

A focused view of the Infragistics Ultimate UI for Uno Platform samples browser’s DataGrid overview combines image cells, sales data bars, conditional colors, and summaries. All values are sample data.
Use hyperlink columns to lead into the next task, such as opening an account or following an order reference. Image columns add a visual identifier; XAML cell templates and template selectors let teams compose custom content for a particular type of record.
Make important results stand out
A sales report becomes easier to act on when an account’s performance is visible at a glance. Conditional formatting can highlight accounts that have reached or exceeded their target, those still within reach, and those that need attention. Positive and negative growth receive distinct text colors, while explicit status labels explain what the colors mean.

Rule-based formatting brings the exceptions forward. The sample applies formatting rules directly to each account’s data.
These rules can reflect your application’s business logic. A revenue threshold, a missed service target, or an inventory level can determine the treatment applied to a cell. Developers configure the conditions and visual properties; users see the meaning beside the underlying values.
Let users build their own working view
Column options put useful changes directly beside the data. Users can open a header menu to sort values, choose which records to include, add summaries, or change how columns are arranged. A finance user can prioritize the largest accounts, while a regional manager can focus on their own territory.

The live Revenue column menu combines sorting, summaries, and value selection with commands for moving, pinning, hiding, and grouping columns.

Choose Sort Descending to bring the largest accounts to the top. The grid keeps the other values aligned with their records.

Select the region that matters, then apply the filter. The choices belong to the working view; the source records remain available.

The filtered view contains three Americas accounts and an updated $1,835,000 revenue total. Sorting remains in effect.

Keep Account pinned for context and hide Target to focus on the measures needed for this task. These changes were made through the live column menu.
Replace repeated labels with clear context
Cell merging makes repeated values easier to scan. In this view, each region name appears once in a cell spanning its adjacent accounts. Revenue, targets, growth, and the account records themselves remain separate.

Merging removes repeated region labels while preserving the detail on every account row.
Move between detail and the bigger picture
Grouping and summaries organize accounts into expandable regional sections. Subtotals reveal each region’s contribution, and an overall summary keeps the complete result in view. Users can inspect the records behind a number without moving to a separate report.

Here you can see the grouped values summarized in the grid’s summary row.
Keep live data and ordering easy to follow
Multi-column sorting can show numbered priorities so users can see how the ordering is built. Data bars make relative size easier to compare alongside exact numbers, and alternate-row styling helps readers follow a record across a wide table. Live updates can keep the view current as values change.

Composition, hierarchy, and conversion
The visualization collection also includes DataPieChart, PieChart, and DoughnutChart for part-to-whole views. Show how a portfolio, product mix, or category of spending contributes to the total, then use labels, legends, tooltips, and selection to help readers inspect an individual contribution.

A labeled composition view makes the relationship between individual uses and the total immediately visible.
Use DataPieChart for a flat part-to-whole view. When the story has more than one level of hierarchy, DoughnutChart can show the values across multiple rings. In this revenue example, the inner ring shows divisions and the outer ring breaks each division into its teams. Matching color families and aligned slice boundaries make it easy to follow a division outward to the teams that contribute to it, while comparing each team’s share of total revenue.

Two rings, one hierarchy: Cloud contributes 40% of revenue, made up of Platform at 24% and Analytics at 16%. Each outer-ring group adds up to its parent in the inner ring. Values are illustrative.
FunnelChart presents staged values for conversion and progression: a sales pipeline, an application process, or demand moving through successive steps. Treemap provides a space-filling view of a hierarchy, making large contributors visible within their parent groups.

Treemap uses tile area to show relative size while group headers preserve the hierarchy. This sample organizes population by region and country.
Build rich geographic visualizations
GeographicMap adds a geographical perspective to the application. Plot locations, compare proportional symbols, or use polygonal shapes and layers to connect a business measure with the places it describes.

The geographical bubble sample uses marker size and color to compare city populations. The map is framed on a region so the relationships are easier to inspect. Map data © OpenStreetMap contributors.
A service workspace can put facility locations beside their current readings. A sales application can connect account records with regional coverage. The same shared application can present the map alongside a detailed grid on a desktop and open it as a focused view on a smaller device.
Make current values and targets easier to compare
RadialGauge, LinearGauge, and BulletGraph put individual measures into context. Use a dial for an instrument-style reading, a linear scale beside related data, or a bullet graph to compare an actual value with a target and qualitative ranges.

A radial presentation gives current readings a clear position within their configured scales and ranges.

Linear gauges can communicate operating bands and thresholds in a compact horizontal presentation.

Bullet graphs keep the actual result, target marker, and background ranges together for quick comparison.
Sparkline adds a compact view of change over time. Place it near a current value or in a dense analytical layout so a user can see whether a result is rising, falling, or unusually volatile before opening a larger chart.

Sparkline marker options help identify meaningful points in a compact trend. The sample’s property editors let users explore the presentation interactively.
Build dashboards people can explore and personalize
DashboardTile brings a visualization, commands, supporting data, and configuration into one configurable and dynamic surface. Use it to turn a fixed report into a workspace people can explore: inspect the visualization, work with its toolbar, open settings, or look at the underlying records.
DashboardTile goes further than CategoryChart in shaping a view from bound data. It infers a suitable starting visualization from the data’s structure, then lets the end user choose another presentation through the tile’s controls.

The financial dashboard sample places related series and their commands together in the same tile.
The property editor provides a path from chart-wide options into individual series and nested collections. Applications can save settings as JSON and decide how to store and restore an end user’s configuration or share a useful preset.


The shared-behavior benefit is particularly useful here. Teams can offer the same model of customization across Uno Platform target platforms while choosing a settings layout appropriate to the screen. Users learn what they can change once; the application decides how to present those options on each device.
Put chart commands and property editing within reach
Toolbar and ToolPanel organize commands and settings around the visualizations people are using. PropertyEditorPanel provides an editing surface that understands the properties of Infragistics Ultimate UI for Uno Platform components. Teams can expose useful customization with less application-specific interface code.
Put chart commands, series choices, and color settings within reach in the toolbar. Use the property editor to take users from a chart-wide setting into an individual series or a nested collection. The controls provide a shared way to explore these choices across Uno Platform target platforms, while the application decides which settings to expose.

The toolbar color-editor sample puts a presentation choice beside the chart it affects.

Together, these controls let teams build the complete workflow: choose the records, investigate the data, change the view, and act on the result.
Established components also give AI-assisted development a reliable foundation. Agents can work with defined component APIs, shared presentation rules, and configurable behavior as they build your application’s workflows. Teams bring years of component engineering into that work and can focus review on the application’s data, integration, and user experience.
What’s in the beta collection?
| Area | Components and supporting capabilities |
|---|---|
| Analytical charts | DataChart, CategoryChart; category, range, scatter, bubble, financial, polar, radial, shape, Sankey, radial Sankey, and vertical series. |
| Composition and hierarchy | DataPieChart, PieChart, DoughnutChart, FunnelChart, and Treemap. |
| Geographic visualization | GeographicMap and its geographic series. |
| Compact trends and indicators | Sparkline, RadialGauge, LinearGauge, and BulletGraph. |
| Chart exploration | DataLegend, Legend, ItemLegend, ScaleLegend, FinancialLegend; tooltips, highlighting, selection, callouts, and annotation layers. |
| Tabular data | DataGrid; conditional formatting, column options, cell merging, sorting, filtering, grouping, summaries, selection, and editing. |
| Dashboards | DashboardTile and its visualization, command, data-inspection, and property-editing workflows. |
| Visualization commands and configuration | Toolbar, ToolPanel, and PropertyEditorPanel. |
Explore the beta with your own application
Start with the Infragistics Ultimate UI for Uno Platform samples. Browse the examples, inspect their C# and XAML, and choose a scenario close to the application you want to build. The repository provides a combined samples browser as well as individual sample projects; its setup instructions describe the required tooling and packages.
Then bring your own data and shared workflows into the picture. Try a grouped grid alongside a chart, a map connected to business records, or a dashboard that users can personalize. Run that experience on the Uno targets your audience needs, and help us shape the beta with feedback on the components and interactions that matter to your team.
Infragistics Ultimate UI for Uno Platform is currently in beta. General availability and pricing details will follow.
Start your Infragistics Ultimate trial or explore the Uno Platform samples. Use the samples’ setup instructions to configure the tooling and packages for evaluating Infragistics Ultimate UI for Uno Platform.
One shared foundation, a broad component collection, and a familiar way to work with data wherever your Uno Platform application runs.
Screenshots show freshly built Infragistics Ultimate UI for Uno Platform desktop samples. The reused What’s New animations identify their capture platform in their captions. Sample data is illustrative. Agents assisted with synthesizing information on our available feature set; humans edited the content.


