
Quickly Build High-Performance jQuery Apps
Choose from 100+ JavaScript UI components and build data-rich, responsive web apps, while delivering the best UX on modern browsers. Easy integration with Razor Pages, Angular, AngularJS, React, Bootstrap, Knockout, and more.

The Fastest jQuery Data Grid
Our jQuery data grid is the fastest on the market, delivering intuitive and easy-to-use JavaScript API, built-in touch support, responsive web design elements, and attractive UX. Packed with robust line of business features such as editing, filtering, grouping customization, and Excel export, our JavaScript grid helps you manage and present data in a tabular format quickly and efficiently.
Trusted by the World's Best
Ignite UI’s strength in Excel is truly top-notch... Having features ready for LOB apps and high-quality technical support helped our development.
Pasona Tech
To continue providing customers with cutting-edge technological features, B-EN-G set out to meet the needs of customers wishing to connect to a new range of devices that make up the Internet of Things (IOT). Read More
The Fastest jQuery Charts
With JavaScript for charts, you can build expressive dashboards, apply deep analytics, and render millions of data points. Our comprehensive JavaScript chart library is packed with 60+ real-time charts, including the most asked for financial, trendlines, and pie charts. From stock trending visualizations, through business intelligence reports, and other visualized metrics — Ultimate UI for jQuery components fulfill your fintech and business needs. All with extensive documentation including fundamentals of JavaScript for charts, with JavaScript chart examples so your jQuery dev team can quickly learn how to transform raw data into informative dashboards.

A jQuery Chart for Every Occasion
Your charts shouldn’t just be fast; they should be all-encompassing. With every common category chart type – bar, line, column, pie, area, stacked series, and more – you can visualize your data the way you prefer. In need of financial charts? We offer the same features you come across with Google Finance and Yahoo Finance Charts.
Most Popular jQuery Components
Built for the enterprise with unique features and incomparable performance.
- Spreadsheet Add fully-functional visualizations of spreadsheet data, including Workbooks, Worksheets, Formulas and more. Learn More
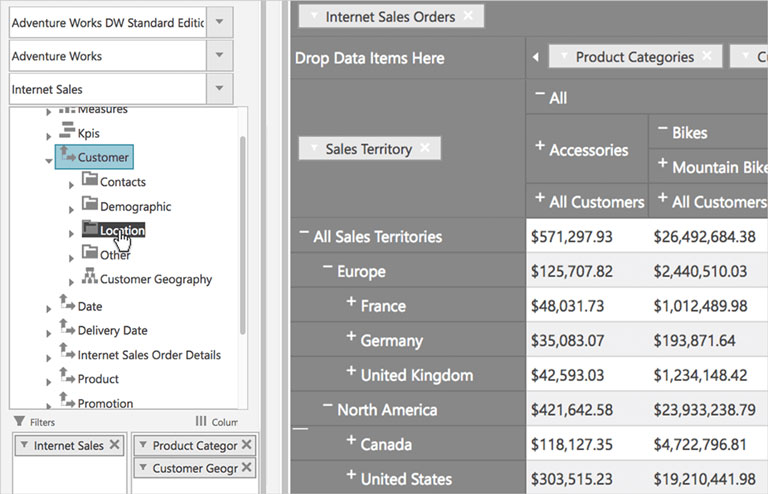
- Pivot Grid Display data in a pivot table and enable users to perform complex analysis on supplied data. Learn More
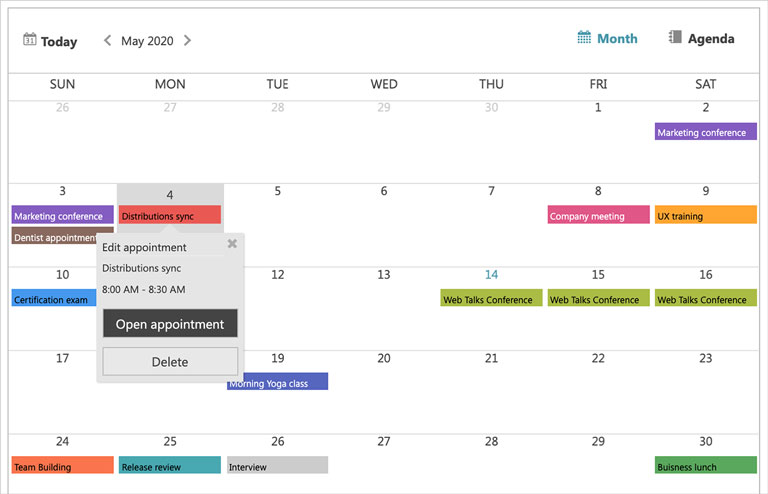
- Schedule Provide users with a common solution for presenting and managing time periods and the associated activities. Learn More


jQuery UI Components To Ignite Your Next Project
Inspiration Is Everywhere
Get started on your next great project with over 100 jQuery UI components and designs to help you create data-rich, responsive web apps.
View All Reference Applications
Marketing Dashboard App
This jQuery Marketing Dashboard displays data visualizations that are actionable, leveraging multiple charts and grids.
Get the App
Stock Tracker App
Tracks stocks and monitor thousands of data points for in-depth analysis.
Get the App
Finance App
The Finance Dashboard sample demonstrates the data chart, combo, dialog, and zoom bar controls for the Financial Services industry.
Get the AppResources
Leverage these helpful resources to learn how to build better web apps, faster.
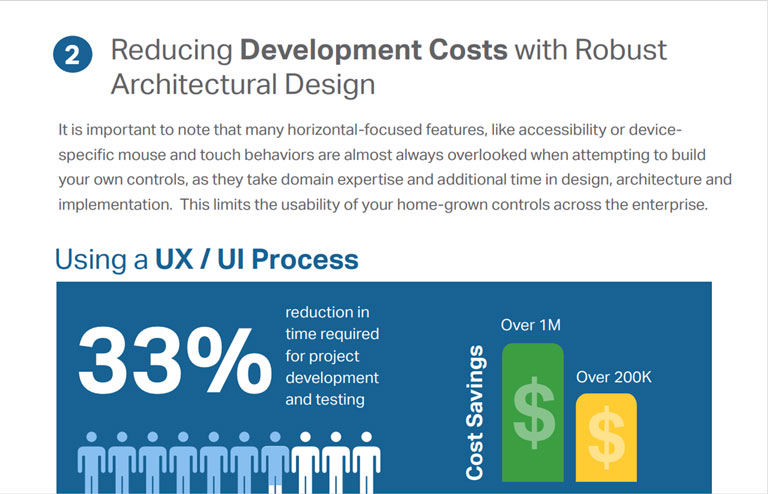
- UI Toolkit Standardization Leveraging a standard UI toolkit can help reduce project development and testing time by 33%. Read this whitepaper and learn how your organization can reduce time-to-market and development costs. Learn More
- Getting Started with the Ignite UI CLI Get started with your next project faster using the Ignite UI CLI. This tool helps to initialize, develop, scaffold, and maintain applications in a wide variety of frameworks, providing predefined templates for Ignite UI for jQuery components. Learn More
- Desktop to Web Learn how you can build high-performance, progressive web apps in modern frameworks, such as Angular using Ignite UI. Learn More


Help and Samples
Everything you need to get started with your next jQuery project!
Choose the Plan That's Right for You!
Explore our pricing bundles crafted to fit your needs, providing comprehensive solutions for every project size. With user experience 'built-in' to every control and our commitment to a continuous release schedule, you're guaranteed the fastest updates across all major frameworks, ensuring your applications stay cutting-edge.
- Everything in Ignite UI and Professional
- UI prototyping, design systems, user testing, app building and code gen
- The only complete UI/UX toolkit for building high performance, modern web, desktop and mobile applications
MULTI-YEAR DISCOUNT
- Everything in Ignite UI
- Comprehensive UI component library for web, mobile and desktop developers
MULTI-YEAR DISCOUNT

Join the Conversation
Frequently Asked Questions
Questions and Answers for Ignite UI for jQuery
What is jQuery used for?
jQuery is a JavaScript library of helper functions and dev accelerators designed to make the process of traversal of HTML DOM tree, CSS animation, event handing, developing Ajax based apps much faster and easier. It simplifies common tasks that would usually require many lines of code in JavaScript, making your code more concise and reusable.
What are jQuery widgets?
jQuery widgets are comprehensive UI controls that provide functionality, customize app behavior, and rich interactions that all lead to better UX. Some of the most popular widgets in jQuery include accordion, sliders, tabs, data grid, chart, spreadsheet, Gantt, pivot grid and much more.
What are web components JavaScript?
Web Components in JavaScript represent a set of technologies (web platform APIs), letting JavaScript designers to build reusable Custom Elements with specific functionalities and styling and use them in a JavaScript library. Components consists of blocks of code with encapsulated HTML elements and tags, including CSS and JavaScript. They can be used in websites and web apps.
How to use jQuery UI widgets?
You can try out different demo sections that will present you with a list, consisting of all the jQuery UI widget demo samples. Once you select a demo sample, you will get corresponding demo configurations. Using the demo, you can view and inspect the source code and see how applied changes work.
How to create a grid in JavaScript?
Creating a JavaScript grid is easy. Just create an HTML Table, add Table Rows and Table Cells, and with the power of jQuery UI and JavaScript, in a few lines of code you have an interactive JavaScript grid.
You can bind the igGrid to different data sources such as JSON, XML, HTML tables, etc. The igGrid works with popular open-source libraries: KnockoutJS, History.js, JsRender, and Bootstrap.
If you want to see an example and get a code view, click here.
What is Ultimate UI for jQuery?
Ultimate UI for jQuery is a complete library of user interface (UI) components for building data-rich and responsive web apps, including 100+ data charts, grids, and components.
What makes Ultimate UI for jQuery different from other UI toolkits?
Ultimate UI for jQuery is the most complete library of enterprise-grade, UI components available. Backed by Infragistics 30+ years of industry leadership and our award-winning live support, Ignite UI for jQuery provides you with everything you need to build modern, progressive web apps.
How does the pricing and licensing for Ultimate UI for jQuery work?
Our jQuery components are included as a part of Infragistics Professional. A single developer license starts at $1,575 USD for a one-year subscription, including one year of standard support and updates. We also offer discounts for multi-year licenses. Please refer to our Pricing page for more information on pricing.
How do I get started with Ultimate UI for jQuery?
The best place to begin is with our Getting Started Documentation.
Connect with Infragistics
Follow Us for the Latest News and Updates