Infragistics React vs Highcharts

  • React Optimized Charting
  • The Fastest HTML5 Chart on the Market
  • Most Complete Charting Library of Over 65+ Chart Types plus Financial Charting and Geospatial Mapping
  • Rich UI Controls like Data Grid / Data Table
  • Full-Featured Microsoft Excel Library with Chart-Exporting Capability
Ignite UI React Reference Apps

See Why Ignite UI for Angular Tops the Charts:

 
Ignite UI for React Highcharts
  • Fastest HTML5 Chart on the planet.
  • Milli-Second load times for millions of data points in chart with real-time streaming data support.
  • 12 Series Types, 65+ Chart Types.
  • Financial Charting
  • SVG render only – causing slow rendering with any meaningful data volumes.
  • Chart crashes browser with high data volumes.
  • Complex interactions make chart unusable (Tooltip hovering, Mouse panning and zooming, etc).
  • US, Japan, London, India and Sofia based technical support, global account management and direct pre- & post- sales support
  • 24x5 Technical Support
  • 48-hour standard support response time
  • Public forums, Email, Chat and Phone support
  • Limited support options in CET (Central European Time)
  • No account management, No Technical Pre or Post-Sales
  • Limited to 10 hours of support for the 12 months
  • Simple pricing for all UI controls and components for 1 price.
  • $695 per developer
  • Unlimited applications
  • No Server, deployment, royalty or runtime fees
  • Open Source + Commercial License
  • Complex pricing for a Visualization-only offering.
  • $445 per-developer for Charting Only. $615 with support.
  • $1,340 per-developer for Charts + Financial Chart + Maps without support. $1,510 with premium support.
  • Free creative commons (cc) attribution-noncommercial license, for non-profit and/or personal use.

Additional Information to Help You Decide

If you are considering any other React Charts on the market, here are a few things to think about:

  • Simplest configuration on the market with our smart data adapter.
  • The chart is optimized per platform. We have a native Angular chart, a React chart, a jQuery / JavaScript chart, a WPF chart, a Windows Forms chart, and a Xamarin chart, all supporting the same API and same features on every platform.
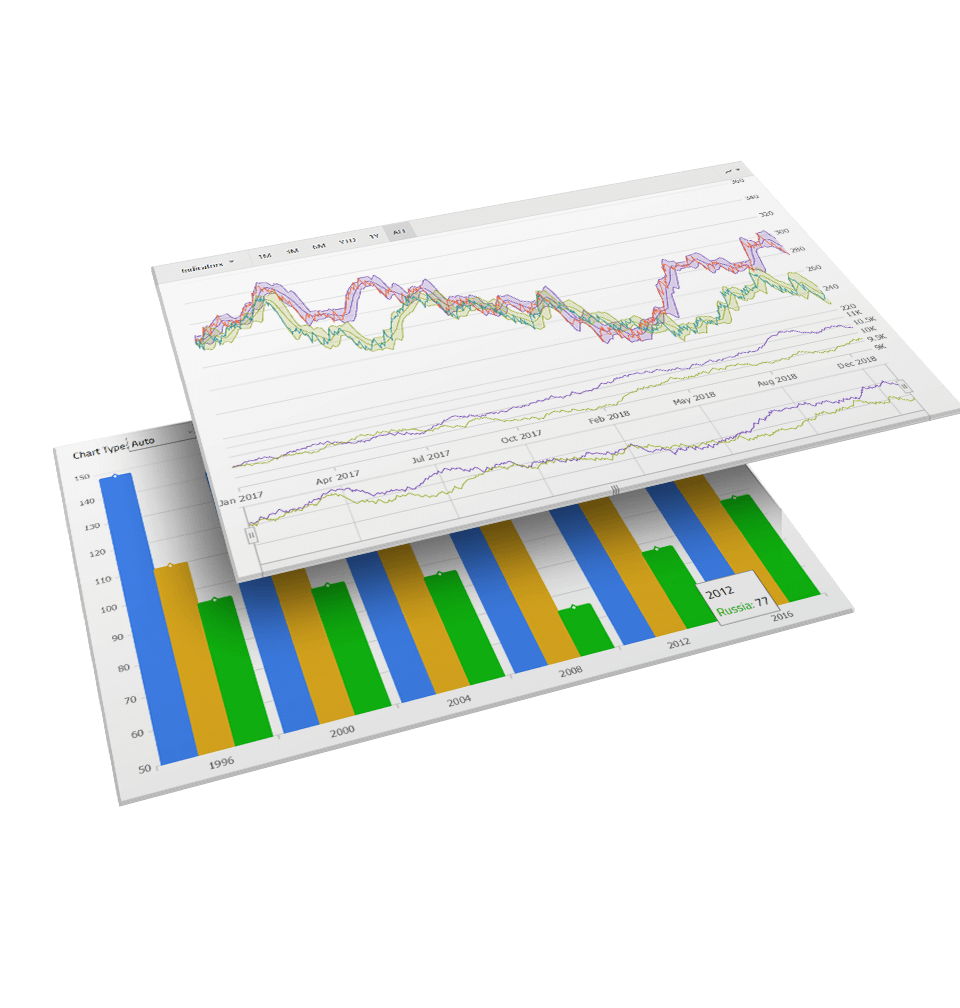
  • Our financial charting gives you everything you need for a Yahoo Finance or Google Finance-like experience – all with a single line of code.
  • We test against everyone else’s performance. People say they are fast and can handle lots of data, but we can prove it. See for yourself how we handle high-volume data and real-time data streaming.
  • We have more than just Charts – we offer React Grid / Table, Excel Library and more with a full roadmap of new capabilities and controls shipping every month.