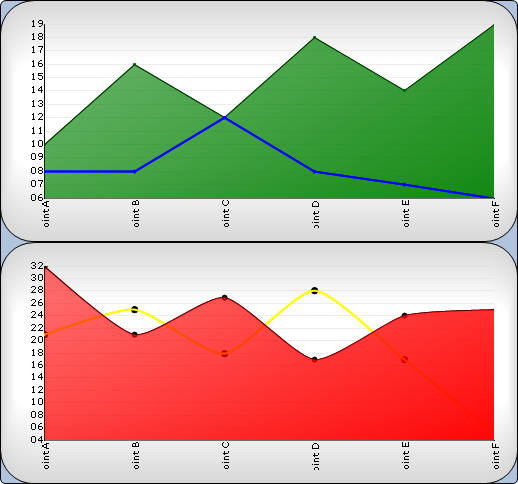

The composite chart type can be used to combine an infinite number of chart types, axes, chart areas, and legends. It is very flexible and offers few limitations.

The composite chart is also more complex and more difficult to learn than any other type of chart. It is highly recommended that you plan the design of a composite chart before writing any code.
Add at least one ChartArea to the ChartAreas collection.
Populate each ChartArea’s Axes collection with axes to plot data on.
Populate the Series collection with data.
Add at least one ChartLayer to the ChartLayers collection.
Set the ChartLayer’s ChartArea property to an existing ChartArea (from step 1) and set the ChartLayer’s AxisX and AxisY properties to existing axes (from step 2) if necessary.
Add the Series (from step 3) to the ChartLayer’s Series collection.