WebDataGrid1.Behaviors.CreateBehavior(Of SummaryRow)()

WebDataGrid allows you and your end users to display a summary of the numeric data in any column. The summaries can be:
Count
Sum
Average
Min
Max
Custom summaries
You can enable summary row behavior on WebDataGrid through the designer, Microsoft® Visual Studio® Property Window or by using the following code:
In Visual Basic:
WebDataGrid1.Behaviors.CreateBehavior(Of SummaryRow)()
In C#:
WebDataGrid1.Behaviors.CreateBehavior<SummaryRow>();
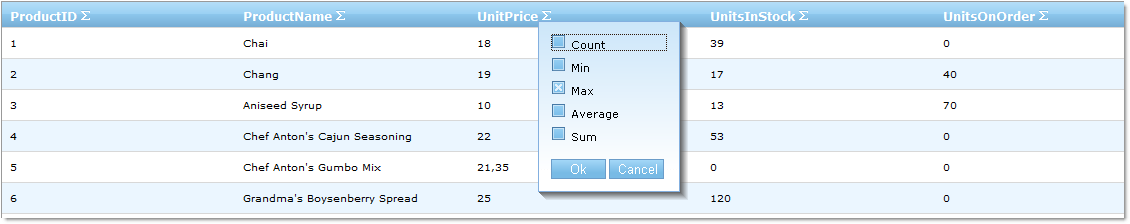
When enabled, the behavior adds a summary button to each header. When the button is pressed, a drop-down with available summaries appears.
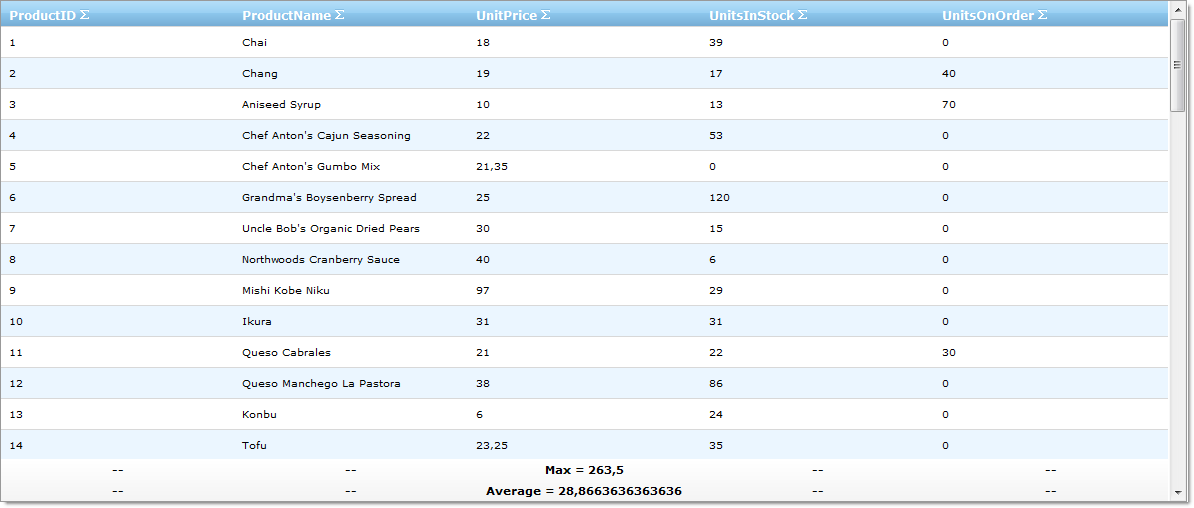
Bind WebDataGrid to a SqlDataSource component retrieving data from the Products table. Retrieve the ProductID, ProductName, UnitPrice, UnitsInStock and UnitsOnOrder fields. For more information on doing this, see Getting Started with WebDataGrid topic.
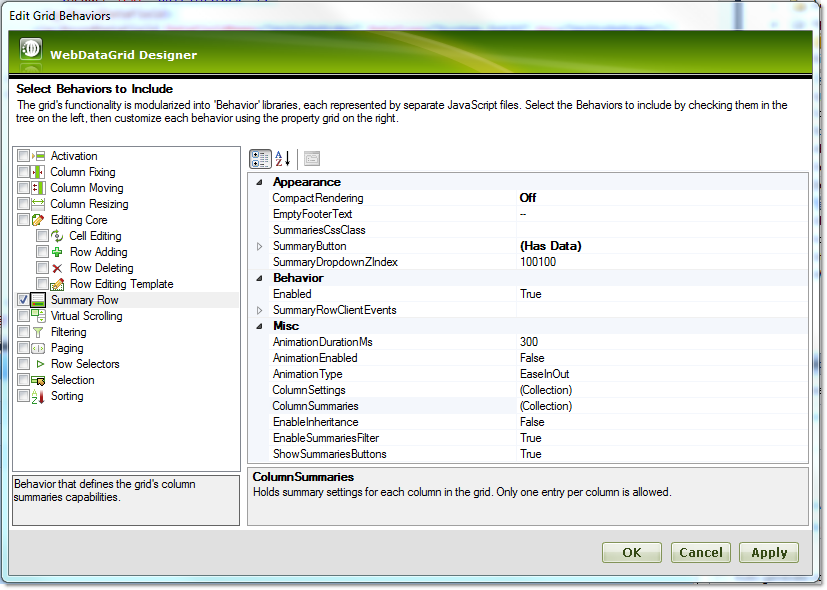
In the property window, locate the Behaviors property and click the ellipsis (…) button to launch the Edit Behaviors Dialog.
Check the Summary Row behavior to enable it, as shown in the following image:
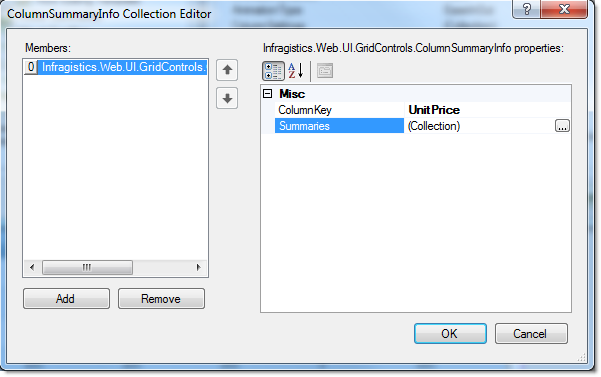
Click on ColumnSummaries ellipsis(…) button to launch the ColumnSummaryInfo Editor Dialog.
Click on the Add button. Choose “UnitPrice” in the ColumnKey property.
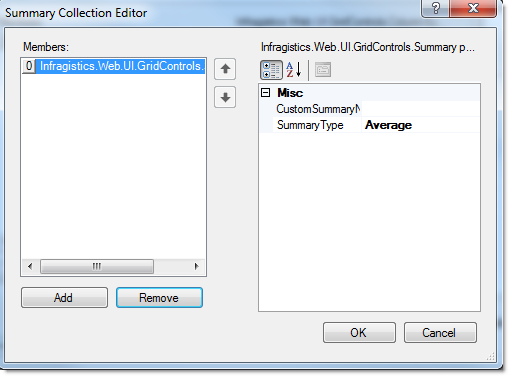
Click on the Summaries ellipsis(…) button to launch the Summary Collection Editor Dialog.
Click on the Add button. Open the SummaryType drop down button and choose Average.
Repeat the previous step. Choose Max from the SummaryType drop-down step and click on the ok button to close the dialog. The following markup should be generated:
In HTML:
<Behaviors>
    <ig:SummaryRow AnimationType="Linear">
        <ColumnSummaries>
            <ig:ColumnSummaryInfo ColumnKey="UnitPrice">
                <Summaries>
                    <ig:Summary SummaryType="Average" />
                    <ig:Summary SummaryType="Max" />
                </Summaries>
            </ig:ColumnSummaryInfo>
        </ColumnSummaries>
    </ig:SummaryRow>
</Behaviors>
To add a summary row from the code-behind, add the following code:
In Visual Basic:
Dim unitPriceSummary As New ColumnSummaryInfo()
unitPriceSummary.ColumnKey = "UnitPrice"
unitPriceSummary.Summaries.Add(SummaryType.Average)
unitPriceSummary.Summaries.Add(SummaryType.Max)
WebDataGrid1.Behaviors.SummaryRow.ColumnSummaries.Add(unitPriceSummary)
In C#:
ColumnSummaryInfo unitPriceSummary = new ColumnSummaryInfo();
unitPriceSummary.ColumnKey = "UnitPrice";
unitPriceSummary.Summaries.Add(SummaryType.Average);
unitPriceSummary.Summaries.Add(SummaryType.Max);
WebDataGrid1.Behaviors.SummaryRow.ColumnSummaries.Add(unitPriceSummary);
Run the application. WebDataGrid displays Average and Max summary for the UnitPrice column. You can add additional summaries by clicking the summary button at the header of the columns and choosing a summary type from the drop down options.