
The purpose of this topic is to introduce the funnel chart. A funnel chart is a type of chart that displays quantities as percentages of a whole, much like a pie chart. Funnel charts are commonly used to display quantitative data in relation to stages of a process. For example, a funnel chart might display expenses of a product from the manufacturing stage to the actual sale of that product.
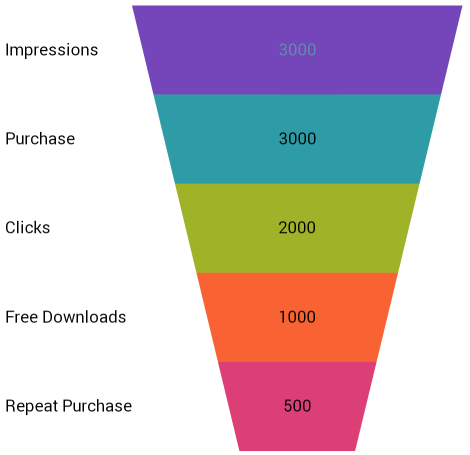
Following is a preview of the UltraFunnelChart.
Figure 1: Sample UltraFunnelChart control
The UltraFunnelChart also allows inverting the slices vertically using the IsInverted Boolean property as in the image below:
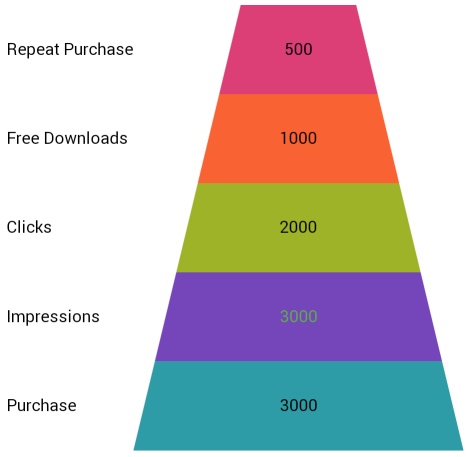
Figure 2: Sample UltraFunnelChart inverted
Please refer to the following supporting documents for more information:
Getting Started with UltraFunnelChart, which highlights the key features provided by funnel chart.
Data Binding demonstrates how to bind to the funnel chart.
API Overview contains the list of namespaces and several key classes to know while programming with the control.