
This topic provides information on how to use the GeographicContourLineSeries type of series in the UltraGeographicMap™ control.
The following table lists the topics required as a prerequisite to understanding this topic.
This topic contains the following sections:
In the UltraGeographicMap control, the GeographicContourLineSeries is a visual map element that draws colored contour lines, in a geographic context, based on a triangulation of longitude and latitude data with a numeric value assigned to each point.
This type of geographic series is useful for rendering scattered data defined by geographic locations such as weather temperature, atmospheric pressure, precipitation, population distribution, topographic data, etc. The GeographicContourLineSeries works a lot like the GeographicScatterAreaSeries except that it represents data as contour lines, colored using a fill scale and the geographic scatter area series, represents data as a surface interpolated using a color scale.
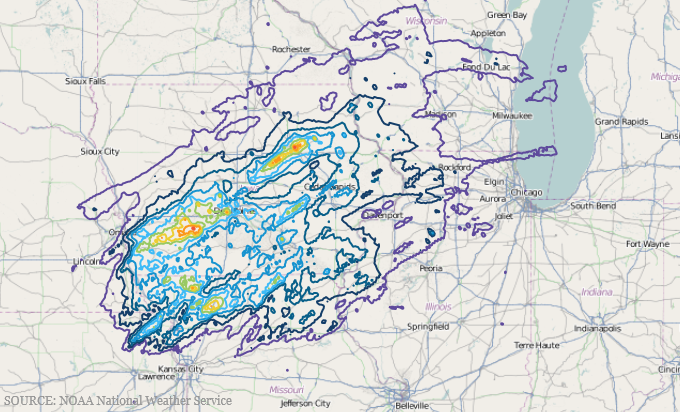
The following is a preview of the control with GeographicContourLineSeries plotting precipitation over the United States. Darker blue contours indicate lower precipitation and the lighter red contours indicate higher precipitation.
Similar to other types of geographic series in the UltraGeographicMap control, the GeographicContourLineSeries has the DataSource property for data binding. This property can be bound to an object that implements an IEnumerable interface.
In addition, each item in the items source must have three data columns, two that store geographic location (longitude and latitude coordinates) and one data column that stores a value associated with the geographic location. These data column, are identified by LongitudeMemberPath, LatitudeMemberPath, and ValueMemberPath properties of the geographic series.
The GeographicContourLineSeries automatically performs built-in data triangulation on items in the DataSource if no triangulation is set to the TrianglesSource property. However, computing triangulation can be a very time-consuming process, so the runtime performance will be better when specifying a TriangulationSource for this property, especially when a large number of data items are present.
The following table summarizes properties of GeographicContourLineSeries used for data binding.
Use the FillScale property of the GeographicContourLineSeries to resolve fill brushes of the contour lines of the geographic series.
The provided ValueBrushScale class should satisfy most of your coloring needs, but the application for custom coloring logic can inherit the ValueBrushScale class.
The following table list properties of the CustomPaletteColorScale affecting the surface coloring of the GeographicContourLineSeries.
The following code shows how to bind the GeographicContourLineSeries to triangulation data representing precipitation over the United States.
In Visual Basic:
Dim itfConverter = New ItfConverter()
itfConverter.Source = New Uri("precipitation_observed_20110831.itf", UriKind.RelativeOrAbsolute)
Dim fillScale = New ValueBrushScale()
fillScale.MinimumValue = 0.05
fillScale.MinimumValue = 1.75
fillScale.Brushes = New BrushCollection()
fillScale.Brushes.Add(New SolidColorBrush(Colors.DarkRed))
fillScale.Brushes.Add(New SolidColorBrush(Colors.Red))
fillScale.Brushes.Add(New SolidColorBrush(Colors.Orange))
fillScale.Brushes.Add(New SolidColorBrush(Colors.Yellow))
Dim geoSeries = New GeographicContourLineSeries()
geoSeries.FillScale = fillScale
geoSeries.LongitudeMemberPath = "Point.X"
geoSeries.LatitudeMemberPath = "Point.Y"
geoSeries.TriangleVertexMemberPath1 = "V1"
geoSeries.TriangleVertexMemberPath2 = "V2"
geoSeries.TriangleVertexMemberPath3 = "V3"
geoSeries.DataSource = itfConverter.TriangulationSource.Points
geoSeries.TrianglesSource = itfConverter.TriangulationSource.Triangles
In C#:
var itfConverter = new ItfConverter();
itfConverter.Source = new Uri("precipitation_observed_20110831.itf", UriKind.RelativeOrAbsolute);
var fillScale = new ValueBrushScale();
fillScale.MinimumValue = 0.05;
fillScale.MinimumValue = 1.75;
fillScale.Brushes = new BrushCollection();
fillScale.Brushes.Add(new SolidColorBrush(Colors.DarkRed));
fillScale.Brushes.Add(new SolidColorBrush(Colors.Red));
fillScale.Brushes.Add(new SolidColorBrush(Colors.Orange));
fillScale.Brushes.Add(new SolidColorBrush(Colors.Yellow));
var geoSeries = new GeographicContourLineSeries();
geoSeries.FillScale = fillScale;
geoSeries.LongitudeMemberPath = "Point.X";
geoSeries.LatitudeMemberPath = "Point.Y";
geoSeries.TriangleVertexMemberPath1 = "V1";
geoSeries.TriangleVertexMemberPath2 = "V2";
geoSeries.TriangleVertexMemberPath3 = "V3";
geoSeries.DataSource = itfConverter.TriangulationSource.Points;
geoSeries.TrianglesSource = itfConverter.TriangulationSource.Triangles;The following topics provide additional information related to this topic.