
Windows Forms Designer support allows you to directly interact with Infragistics controls within the Visual Studio IDE. This is extremely vital for those who looking for a rapid development solution, less privy to manual programming. Front-end visual designers can now take in the design process. The Windows Forms Designer lets you easily add controls from the toolbox to a form, arrange, and write code for their properties and events.
Requirements:
Install .NET 5 or .NET Core 3.1
Install Visual Studio 2019 16.9.4 or later (preview builds are not curently supported).
Supported Controls:
This release introduces several new and improved visual design and configuration options for all of the chart components. e.g. Data Chart, Category Chart, and Financial Chart.
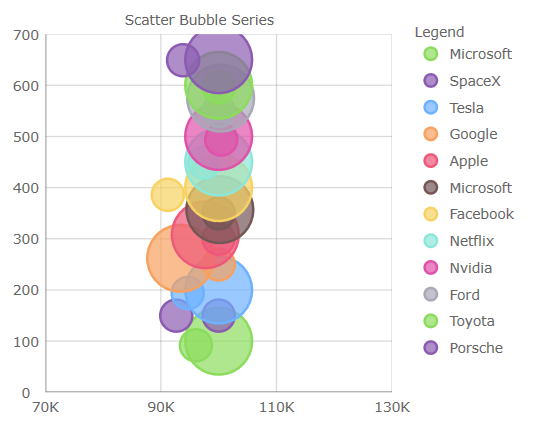
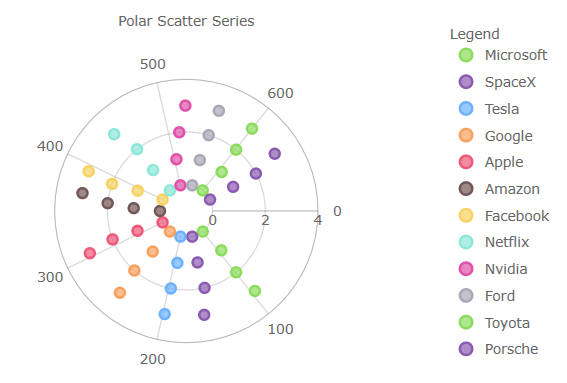
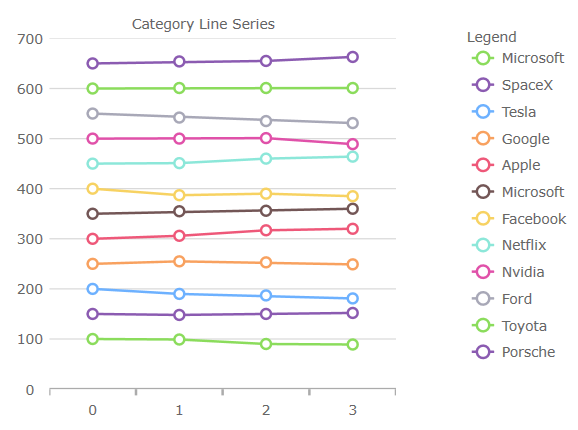
1. New color palette for series/markers in all charts
eg.
2. Changed Bar/Column/Waterfall series to have square corners instead of rounded corners
3. Changed Scatter High Density series’ colors for min/max heat properties
4. Changed Financial/Waterfall series’ colors for negative fill of their visuals
5. Changed marker’s thickness to 2px from 1px
6. Changed marker’s fill to match the marker’s outline for PointSeries, BubbleSeries, ScatterSeries, PolarScatterSeries
Note, you can use set MarkerFillMode property to Normal to undo this change
7. Compressed labelling for the TimeXAxis and OrdinalTimeXAxis
8. New Marker Properties:
MarkerFillMode - Can be set to 'MatchMarkerOutline' so the marker depends on the outline
MarkerFillOpacity - Can be set to a value 0 to 1
MarkerOutlineMode - Can be set to 'MatchMarkerBrush' so the marker’s outline depends on the fill brush color
9. New Series OutlineMode Property:
Can be set to toggle the series outline visibility. Note, for Data Chart, the property is on the series
10. New Plot Area Margin Properties:
The plot area margin properties define the bleed over area introduced into the viewport when the chart is at the default zoom level. A common use case is to provide space between the axes and first/last data points. Note, the ComputedPlotAreaMarginMode, listed below, will automatically set the margin when markers are enabled. The others are designed to specify a Double to represent the thickness, where PlotAreaMarginLeft etc. adjusts the space to all four sides of the chart. These new properties were added:
11. New Highlighting Properties
Several configurations to the series highlighting as been added. In previous releases the highlighting was limited to fade on hover. These new properties were added:
HighlightingMode - Sets whether hovered or non-hovered series to fade, brighten
HighlightingBehavior - Sets whether the series highlights depending on mouse position eg. directly over or nearest item
12. Added Highlighting for the following series:
Stacked
Scatter
Polar
Radial
Shape
13. Added Annotation layers to the following series:
Stacked
Scatter
Polar
Radial
Shape
14. Added support for overriding the data source of individual stack fragments within a stacked series
15. Added custom style events to Stacked, Scatter, Range, Polar, Radial, and Shape series
16. Added support to automatically sync the vertical zoom to the series content
17. Added support to automatically expanding the horizontal margins of the chart based on the initial labels displayed
1. Added Horizontal Orientation for ItemLegend
The following chart types can use ItemLegend in horizontal orientation:
Bubble
Donut
Pie
2. LegendHighlightingMode - Enables series highlighting when hovering over legend items
Added support for wrap around display of the map (scroll infinitely horizontally)
Added support for shifting display of some map series while wrapping around the coordinate origin
Added support for highlighting of the shape series
Added support for some annotation layers for the shape series