
This topic explains various types of Category Series in the XamDataChart™ control.
This topic contains the following sections:
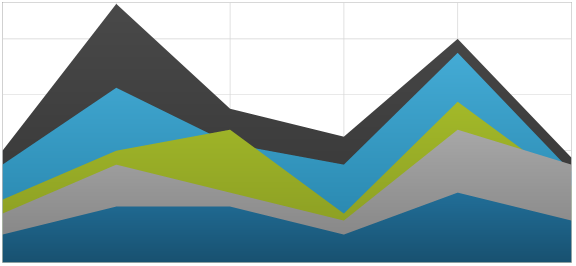
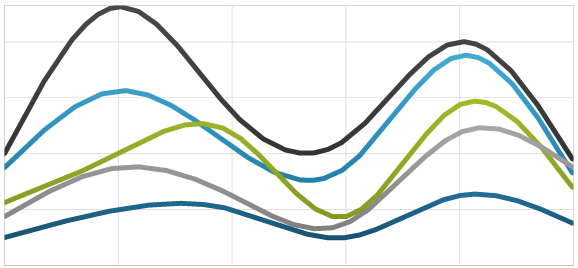
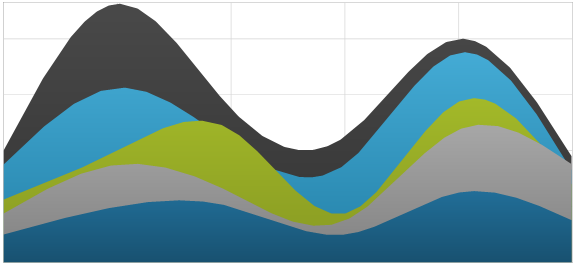
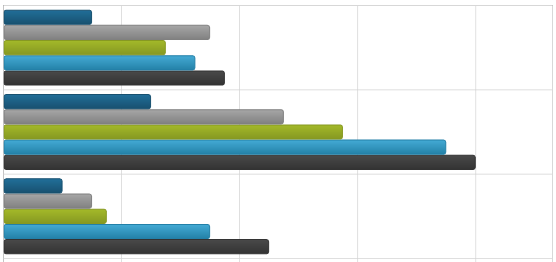
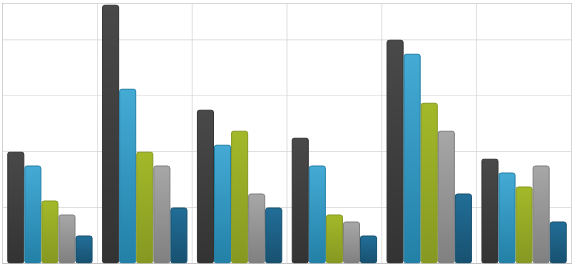
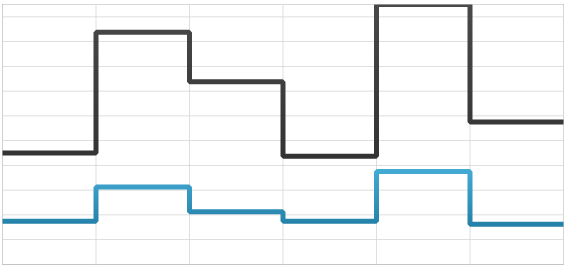
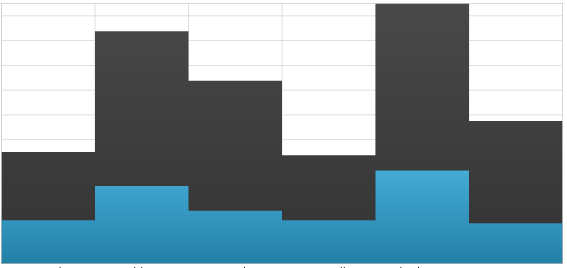
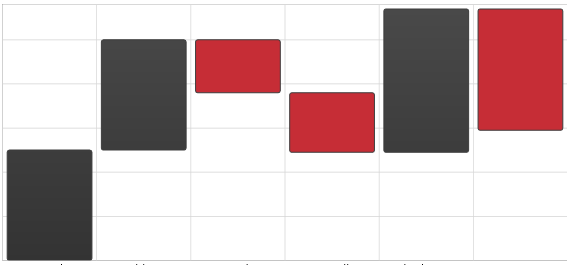
Category Series is a group of the simplest and most common form of chart series that take data and render it as collection of data points stretched along a horizontal line (e.g. column series) or vertical line (e.g. bar series).
The XamDataChart control supports the following types of Category Series and each of them is discussed in an individual topic:
These topics will provide you with useful information on how to use create a specific type of Category Series and bind data to it. This section provides preview images for all types of Category Series.
You can also use multiple types of Category Series with Financial Series or Financial Indicators to create complex charts visuals. Refer to the Adding Multiple Series and Using Multiple Axes topics for more information on this feature of the XamDataChart control.
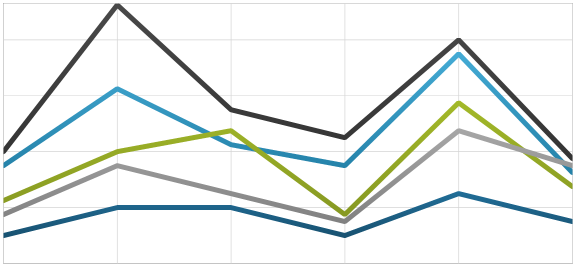
This section provides preview images for all types of Category Series.
Each linked topic demonstrates, with code examples, how to create a specific type of Category Series and bind data to it.
The XamDataChart control provides various types of axes but only the following types of axes can be used with specific types of Category Series. The following table lists these supported axes:
This section provides information about binding data for all types of Category Series from data requirements through data sample to binding diagrams.
Similarly to other types of series in the XamDataChart control, Category Series also use ItemsSource property to bind data. The following is a list of data requirements for Category Series:
The data model should contain one data column (string or date time) which is mapped to the Label property of the category axis (e.g. CategoryXAxis) or the DateTimeMemberPath when using TimeXAxis.
The data model must contain at least one numeric data column which is mapped using the ValueMemberPath property of category series (e.g. LineSeries)
The data source must contain at least one data items otherwise the chart will not render the category series.
The data source must implement the IEnumerable interface (e.g. List, Collection, Queue, or Stack)
For more information on the requirements for the specific types of series, refer to the Series Requirements topic.
An example of object that meets above criteria is the Sample Energy Data which you can download and use it in your project.