
This topic explains, with code examples, how to configure the major and minor intervals for chart axes of the XamDataChart™ control.
The following topics are prerequisites to understanding this topic:
This topic contains the following sections:
In the XamDataChart control, axis major interval specifies how frequent major gridlines and axis labels are rendered on an axis. Similarly, axis minor interval specifies how frequent minor gridlines are rendered on an axis.
Major and minor intervals are supported on all numeric and category, including:
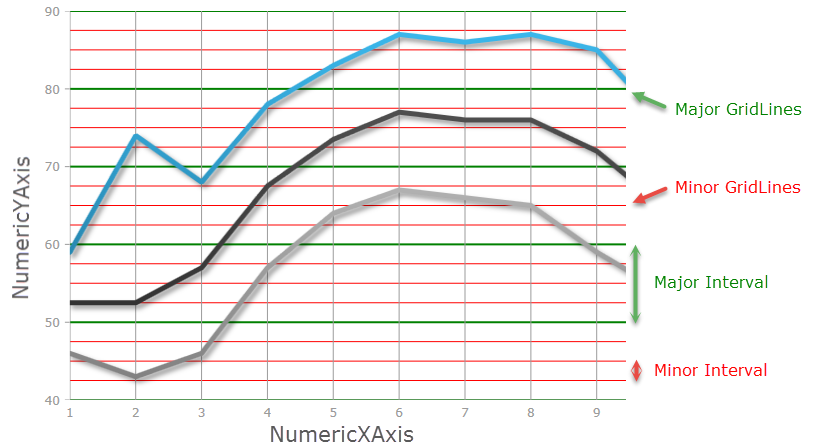
The following screenshot displays a major interval on the NumericYAxis, using major interval value of 10, with a green stroke; and a minor interval on the NumericYAxis, using minor interval value of 2.5, with a red stroke.
Axis major and minor intervals are implemented by setting the Interval and MinorInterval properties on an axis to a value greater than zero. In order to display minor gridlines that correspond to minor interval, one needs to set MinorStroke and MinorStrokeThickness properties on the axis, (as minor gridlines do not have a default color or thickness, and they will not be displayed without first assigning them).
The following table maps the desired effects expressed by the minor interval with property changes necessary to obtain them.
Axis major and minor intervals have the following performance impact on the chart control.
Setting very small value (compared to axis range) for major Interval property will cause chart to render many major gridlines and thus might decrease performance depending on range of axis or when a user is interacting with the chart by zooming or panning. It is recommended to not set this property and let chart automatically calculate appropriate major interval. Also, setting major Interval property will prevent rendering of axis labels and major gridlines when a user zoom in such that the axis range is less than a value of major Interval property. However, the chart will automatically re-calculate major Interval property if property is not set and a user zoom in such that the axis range is less than a value of this property.
Setting very small value (compared to axis range) for MinorInterval property will cause chart to render many minor gridlines and thus decrease performance even more than setting for major Interval property. This might be noticeable by a user is interacting with the chart by zooming or panning.
The screenshot below demonstrates how the NumericYAxis in a XamDataChart control looks as a result of the following interval related settings:
In XAML:
<ig:NumericYAxis x:Name="yAxis"
                  MinorInterval="2.5"
                  MinorStroke="Red"
                  MinorStrokeThickness="1"
                  Interval="10"
                  MajorStroke="Green"
                  MajorStrokeThickness="2"/>
In C#:
var yAxis = new NumericYAxis();
yAxis.MinorInterval = 2.5;
yAxis.MinorStrokeThickness = 1;
yAxis.MinorStroke = new SolidColorBrush("Red");
yAxis.Interval = 10;
yAxis.MajorStrokeThickness = 2;
yAxis.MajorStroke = new SolidColorBrush("Green");
In Visual Basic:
Dim yAxis = New NumericYAxis()
yAxis.MinorInterval = 2.5
yAxis.MinorStrokeThickness = 1
yAxis.MinorStroke = New SolidColorBrush(Red)
yAxis.Interval = 10
yAxis.MajorStrokeThickness = 1
yAxis.MajorStroke = New SolidColorBrush(Green)The screenshot below demonstrates how the NumericXAxis in a XamDataChart control looks as a result of the following interval related settings:
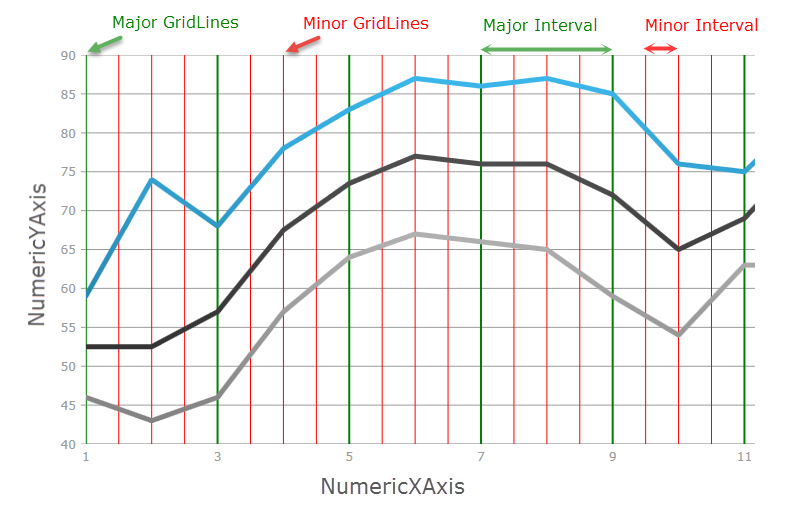
In XAML:
<ig:NumericXAxis x:Name="xAxis"
                  MinorInterval="2.5"
                  MinorStroke="Red"
                  MinorStrokeThickness="1"
                  Interval="2"
                  MajorStroke="Green"
                  MajorStrokeThickness="2"/>
In C#:
var xAxis = new NumericXAxis();
xAxis.MinorInterval = 2.5;
xAxis.MinorStrokeThickness = 1;
xAxis.MinorStroke = new SolidColorBrush("Red");
xAxis.Interval = 10;
xAxis.MajorStrokeThickness = 2;
xAxis.MajorStroke = new SolidColorBrush("Green");
In Visual Basic:
Dim xAxis = New NumericXAxis()
xAxis.MinorInterval = 2.5
xAxis.MinorStrokeThickness = 1
xAxis.MinorStroke = New SolidColorBrush(Red)
xAxis.Interval = 10
xAxis.MajorStrokeThickness = 2
xAxis.MajorStroke = New SolidColorBrush(Green)The screenshot below demonstrates how the CategoryXAxis in a XamDataChart control looks as a result of the following minor interval related settings:
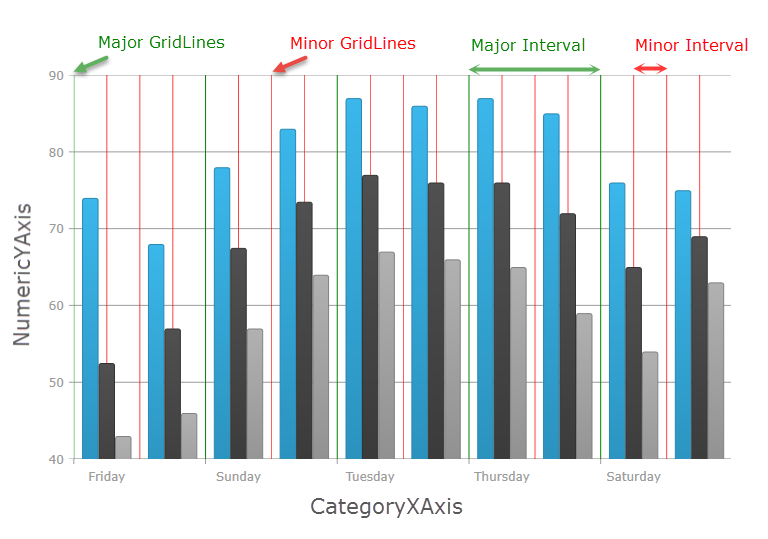
In XAML:
<ig:CategoryXAxis x:Name="xAxis"
                  MinorInterval="2.5"
                  MinorStroke="Red"
                  MinorStrokeThickness="2"
                  Interval="2"
                  MajorStroke="Green"
                  MajorStrokeThickness="1"/>
In C#:
var xAxis= new CategoryXAxis();
xAxis.MinorInterval = 2.5;
xAxis.MinorStrokeThickness = 1;
xAxis.MinorStroke = new SolidColorBrush("Red");
xAxis.Interval = 10;
xAxis.MajorStrokeThickness = 2;
xAxis.MajorStroke = new SolidColorBrush("Green");
In Visual Basic:
Dim xAxis = New CategoryXAxis()
xAxis.MinorInterval = 2.5
xAxisAxis.MinorStrokeThickness = 1
xAxis.MinorStroke = New SolidColorBrush(Red)
xAxis.Interval = 10
xAxis.MajorStrokeThickness = 2
xAxis.MajorStroke = New SolidColorBrush(Green)The screenshot below demonstrates how the CategoryDateTimeXAxis in a XamDataChart control looks as a result of the following interval related settings:
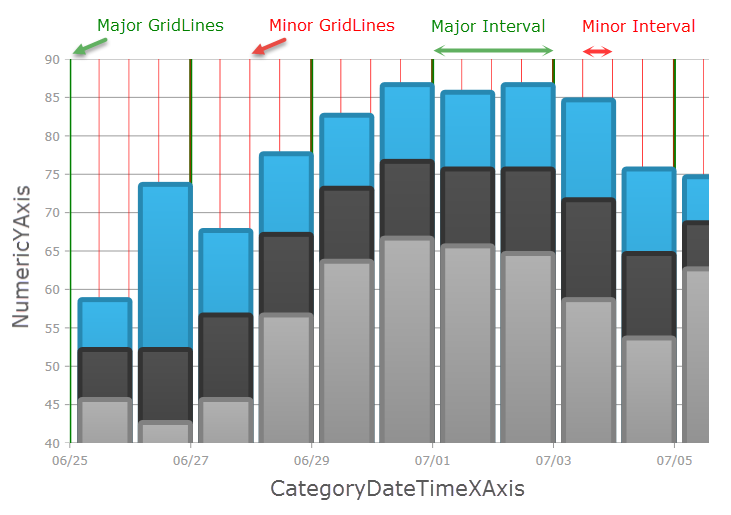
In XAML:
<ig:CategoryDateTimeXAxis x:Name="xAxis"
                  MinorInterval="00:12:00:00.00"
                  MinorStroke="Red"
                  MinorStrokeThickness="1"
                  Interval="02:00:00:00.00"
                  MajorStroke="Green"
                  MajorStrokeThickness="3"/>
In C#:
var xAxis = new CategoryDateTimeXAxis();
xAxis.MinorInterval = new TimeSpan(0, 12, 0, 0);
xAxis.MinorStrokeThickness = 1;
xAxis.MinorStroke = new SolidColorBrush("Red");
xAxis.Interval = new TimeSpan(2, 0, 0, 0);
xAxis.MajorStrokeThickness = 3;
xAxis.MajorStroke = new SolidColorBrush("Green");
In Visual Basic:
Dim xAxis = New CategoryDateTimeXAxis()
xAxis.MinorInterval = New TimeSpan(0, 12, 0, 0)
xAxis.MinorStrokeThickness = 1
xAxis.MinorStroke = New SolidColorBrush(Red)
xAxis.Interval = New TimeSpan(2, 0, 0, 0)
xAxis.MajorStrokeThickness = 3
xAxis.MajorStroke = New SolidColorBrush(Green)The following topics provide additional information related to this topic.