Version

Navigating Chart Using Overview Plus Detail Pane

Topic Overview

Purpose

This topic provides information how to use the xamOverviewPlusDetailPane™ control to navigate content in the XamDataChart™ control.

Required background

The following table lists the topics required as a prerequisite to understanding this topic.

Topic Purpose

This topic provides an overview of key features in the XamDataChart control.

This topic provides information on using navigation in the XamDataChart control.

Chart Overview Pane

Introduction

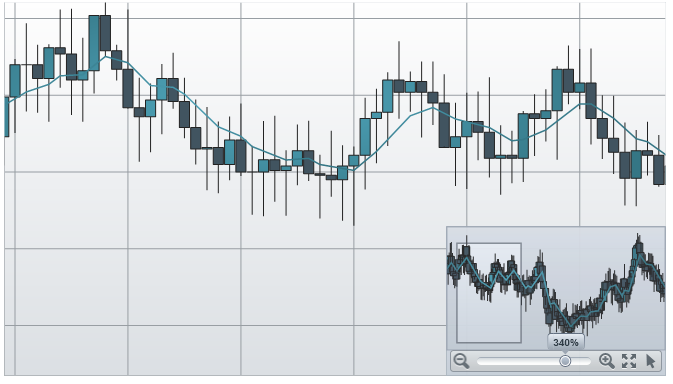
In the XamDataChart control, an overview of chart content is represented by the XamOverviewPlusDetailPane control. This control provides a preview of all types of supported series as well as navigation functionalities.

Preview

The following is previews of the XamOverviewPlusDetailPane control with an overview of the XamDataChart control displaying financial data using FinancialPriceSeries.

xamDataChart Navigating Chart Using Overview Plus Detail Pane 1.png

Example

The following code demonstrates how to display the XamOverviewPlusDetailPane control in upper right corner of the XamDataChart control.

In XAML:

<ig:XamDataChart x:Name="DataChart"
      OverviewPlusDetailPaneVisibility="Visible"
      OverviewPlusDetailPaneHorizontalAlignment="Right"
      OverviewPlusDetailPaneVerticalAlignment="Top">
</ig:XamDataChart>

In Visual Basic:

Dim DataChart As New XamDataChart()
DataChart.OverviewPlusDetailPaneHorizontalAlignment = HorizontalAlignment.Right
DataChart.OverviewPlusDetailPaneVerticalAlignment = VerticalAlignment.Top
DataChart.OverviewPlusDetailPaneVisibility = Visibility.Visible

In C#:

var DataChart = new XamDataChart();
DataChart.OverviewPlusDetailPaneHorizontalAlignment = HorizontalAlignment.Right;
DataChart.OverviewPlusDetailPaneVerticalAlignment = VerticalAlignment.Top;
DataChart.OverviewPlusDetailPaneVisibility = Visibility.Visible;

User Interaction and Usability

User interactions summary

The following table summarizes the user interaction capabilities of the XamOverviewPlusDetailPane control.

The user can… Using… Details

Zoom a chart incrementally

The mouse scroll wheel or zoom in/out buttons of the XamOverviewPlusDetailPane control.

Clicking on the zoom in/out buttons of the XamOverviewPlusDetailPane control or scrolling mouse wheel over the preview area zooms in/out the chart content.

Zoom a chart to a specific level

The zoom slider of the XamOverviewPlusDetailPane control.

Changing the zoom slider of the XamOverviewPlusDetailPane control zooms in/out the chart content to a specific zoom level.

Reset a chart to 100% zoom level

The zoom reset button of the XamOverviewPlusDetailPane control.

Clicking on the zoom reset button of the XamOverviewPlusDetailPane control resets the chart to its 100% zoom level.

Pan chart in all directions

The window rectangle of the XamOverviewPlusDetailPane control.

Dragging the window rectangle in preview area of the XamOverviewPlusDetailPane control pans the chart content in a given direction.

Pan to a specific region of a chart

The preview area of the XamOverviewPlusDetailPane control.

Clicking outside of the window rectangle in preview area of the XamOverviewPlusDetailPane control pans the chart content to chart region where the mouse cursor was clicked.

Change mouse drag interaction with a chart

The cursor button of the XamOverviewPlusDetailPane control.

Clicking on the cursor button of the XamOverviewPlusDetailPane control changes mouse drag interaction with chart to pan on mouse dragging or to zoom on mouse dragging interactions.

Zooming a chart incrementally

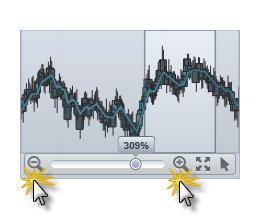
The following picture illustrates how to zoom chart incrementally using the mouse zoom in/out buttons of the XamOverviewPlusDetailPane control.

xamDataChart Navigating Chart Using Overview Plus Detail Pane 2.png

Zooming a chart to a specific level

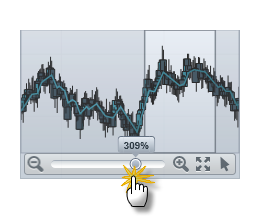
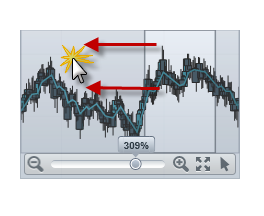
The following picture illustrates how to zoom chart to a specific level using the zoom slider of the XamOverviewPlusDetailPane control.

xamDataChart Navigating Chart Using Overview Plus Detail Pane 3.png

Resetting a chart to 100% zoom level

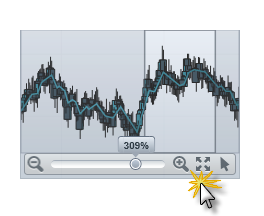
The following picture illustrates how to chart to 100% zoom level using the zoom reset button of the XamOverviewPlusDetailPane control.

xamDataChart Navigating Chart Using Overview Plus Detail Pane 4.png

Panning a chart in all directions

The following picture illustrates how to pan chart in all directions using the window rectangle of the XamOverviewPlusDetailPane control.

xamDataChart Navigating Chart Using Overview Plus Detail Pane 5.png

Panning to a specific region of a chart

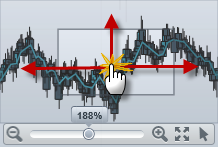
The following picture illustrates how to pan chart to a specific region of chart using the window rectangle of the XamOverviewPlusDetailPane control.

xamDataChart Navigating Chart Using Overview Plus Detail Pane 6.png

Changing mouse drag interaction with a chart

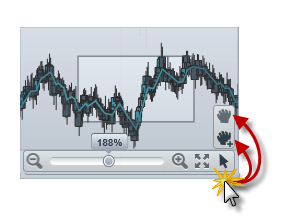
The following picture illustrates how to change a mouse drag interaction with a chart using the cursor button of the XamOverviewPlusDetailPane control.

xamDataChart Navigating Chart Using Overview Plus Detail Pane 7.png

Topics

The following topics provide additional information related to this topic.

Topic Purpose

This topic provides information

This topic provides information

This topic provides information