
The topic demonstrates how to build interaction between the xamPivotGrid™ and the xamDataChart™ controls.
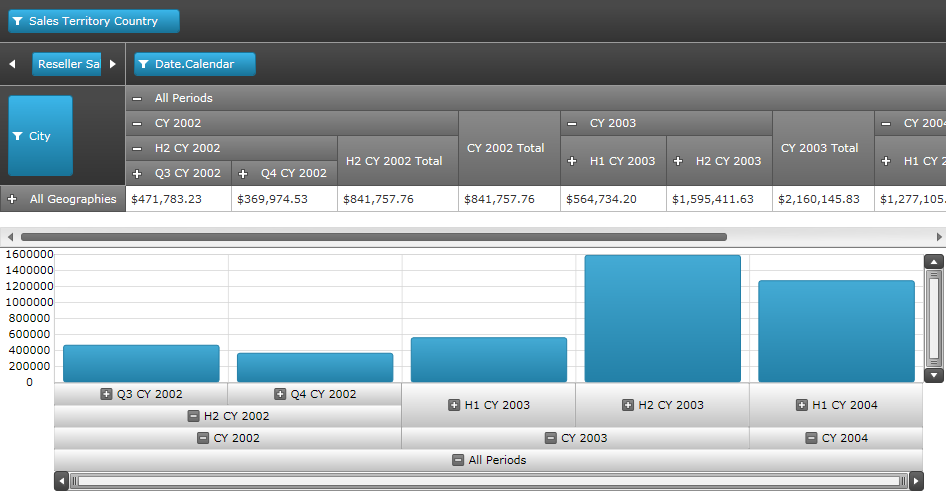
The following is the preview of the final result. The source of OlapAxis can be columns or rows. This screenshot displays the hierarchical view of the columns. If you notice the highest level in the column hierarchy is the “All Periods”, which contains Years followed by Half-years, quarters within each half-year and so on. Both PivotGrid and OlapAxis are bound to the same data source and they are synchronized. If you expand the levels in OlapAxis, the column hierarchies of the PivotGrid will expand and vice versa.
Figure: Preview of the final result.
This topic consists of the following sections:
Required Background
Control Configuration Overview
Set up the DataSource of OlapAxis
Define OlapAxisSource Types
Define the YAxis
Define the Series
You need to first read the following topics:
The xamDataChart control exposes a new axis type called OlapAxis. This new axis exposes a DataSource property, which is the key element of the integration feature. The DataSource property can be bound to the same data source as the pivot grid (XMLADataSource or FlatDataSource).
The table below lists the configurable elements of OlapAxis property that is required for integration with pivot grid.
The table below maps the settings on DataSource property of OlapAxis. For more information on pivot grid data binding please refer to XamPivotGrid Binding Data.
In XAML:
<ig:XamPivotGrid x:Name="pivotGrid"
    DataSource="{StaticResource DataSource}" />

<ig:XamDataChart x:Name="xmOlapDataChart1" >
    <ig:XamDataChart.Axes>
        <igOlapAxis:OlapXAxis DataSource="{StaticResource DataSource}" />
    </ig:XamDataChart.Axes>
</ig:XamDataChart>The table below maps the settings of the source type for OlapAxisSource.
In XAML:
<ig:XamPivotGrid x:Name="pivotGrid"
    DataSource="{StaticResource DataSource}" />

<ig:XamDataChart x:Name="xmOlapDataChart1">
    <ig:XamDataChart.Axes>
        <igOlapAxis:OlapXAxis
            DataSource="{StaticResource DataSource}"
            OlapAxisSource="Rows" />
    </ig:XamDataChart.Axes>
</ig:XamDataChart>The table below maps the settings of YAxis.
In XAML:
<ig:XamPivotGrid x:Name="pivotGrid"
    DataSource="{StaticResource DataSource}" />

<ig:XamDataChart x:Name="xmOlapDataChart1">
    <ig:XamDataChart.Axes>
        <igOlapAxis:OlapXAxis
            DataSource="{StaticResource DataSource}"
            OlapAxisSource="Rows"
            YAxis="{Binding ElementName=yAxis}" />
        <ig:NumericYAxis Name="yAxis" />
    </ig:XamDataChart.Axes>
</ig:XamDataChart>The table below maps the settings for AutoGenerateSeries property for both values (True / False).
The following example uses the mode to automatically generate the series. The data is generated based on the Rows or Columns indicated by OlapAxisSource property.
In XAML:
<ig:XamPivotGrid x:Name="pivotGrid"
    DataSource="{StaticResource DataSource}" />

<ig:XamDataChart x:Name="xmOlapDataChart1">
    <ig:XamDataChart.Axes>
        <igOlapAxis:OlapXAxis
            DataSource="{StaticResource DataSource}"
            OlapAxisSource="Rows"
            YAxis="{Binding ElementName=yAxis}"
            AutoGenerateSeries="True" />
        <ig:NumericYAxis Name="yAxis" />
    </ig:XamDataChart.Axes>
</ig:XamDataChart>
The following example uses the user defined series of special type OlapColumnSeries, while AutoGenerateSeries is set to False.
In XAML:
<ig:XamPivotGrid x:Name="pivotGrid"
      DataSource="{StaticResource DataSource}" />

<ig:XamDataChart x:Name="xmOlapDataChart1">
    <ig:XamDataChart.Axes>
        <igOlapAxis:OlapXAxis
            DataSource="{StaticResource DataSource}"
            OlapAxisSource="Rows"
            YAxis="{Binding ElementName=yAxis}"
            AutoGenerateSeries=" />
        <ig:NumericYAxis Name="yAxis" />
    </ig:XamDataChart.Axes>
    <ig:XamDataChart.Series>
        <ig:OlapColumnSeries
            Title="Customized Title"
            YAxis="{Binding ElementName=yAxis}"
            OlapXAxis="{Binding ElementName=olapXAxis}"
            ValueMemberPath="Europe" />
    </ig:XamDataChart.Series>
</ig:XamDataChart>
Related Topics