this.xamCategoryChart.IncludedProperties = new string[] { "ID", "Name", "Department" };
this.xamCategoryChart.ExcludedProperties = new string[] { "Age" };
This topic demonstrates how to bind both flat and hierarchical data to the XamCategoryChart control. At the end of each section, a complete code sample is provided.
This topic contains the following sections:
The procedure below demonstrates how to bind the XamCategoryChart control to a data collection. The XamCategoryChart allows you to bind to any object that implements the IEnumerable interface. Nested collections that implement ICollection and IEnumerable are also supported.
In this topic you will define two sets of data collection (flat and hierarchical), add the Category Chart control to your application, and bind the control’s ItemsSource to an instance of the designated data collection.
The ChartType property enables you to choose which series type you wish to display. Configuring the ChartType to Auto will result in the chart selecting an Area or Line series to represent the collection (depending on the amount of data points), otherwise it will resolve to Column series. For more information, refer to the Chart Types topic.
Supported series types:
Auto
Area
Column
Line
Point
Spline
StepLine
StepArea
SplineArea
Waterfall
In some cases you may need to explicitly define whether or not a particular property associated with your data model needs to plot as a series by the chart. There are two options in which you can tag a property to be either included or excluded by the XamCategoryChart.
Set the Include and Exclude properties
Each property needs to equal an array of strings which correspond to the names of your properties defined in your data model. In C#:
this.xamCategoryChart.IncludedProperties = new string[] { "ID", "Name", "Department" };
this.xamCategoryChart.ExcludedProperties = new string[] { "Age" };Attribute the properties
Assign a DataSeriesMemberIntent Attribute to the properties to explicitly define their status. The code snippet below demonstrates the ommision of a property, named department, from appearing as a series plotted in the XamCategoryChart.
In C#:
[DataSeriesMemberIntent(DataSeriesIntent.DontPlot)]
public string Department
{
   get { return m_Department; }
   set { m_Department = value; }
}Following are the general requirements for adding the XamCategoryChart control.
Add assembly references by following instructions in the Add References Through NuGet Packages topic.
You can add the XamCategoryChart by using either of the following:
The Infragistics Toolbox.
The code-snippets below.
Also, add the following Infragistics namespaces:
In XAML:
xmlns:ig="clr-namespace:Infragistics.XamarinForms.Controls.Charts;assembly=Infragistics.XF.Charts"In C#:
using Infragistics.XamarinForms.Controls.Charts;Numeric Fields
Each numeric property contained in the collection bound to the chart will be translated as data series values and refer to its name as item and series labels. Without a numeric property defined in your data model the chart will not work as expected. Hierarchical structured data sources are supported to display multiple series without any modifications required to the control or XAML code.
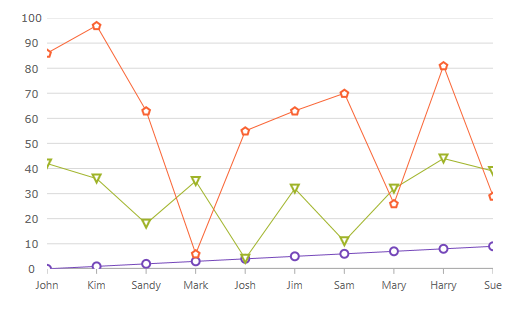
The XamCategoryChart control as implemented by the flat data sample code:
Figure #1
Defining a Data Model
Adding an Instance of the XamCategoryChart control
(Optional) Verifying the result
Define a Data Model
Create a class to model the data. The following code creates a DataItem class representing simple value-label pairs, as well as a Data class representing a collection of those pairs:
In C#:
  public class ViewModel
    {
        public ObservableCollection<DataItem> Data { get; set; }

        public ViewModel()
        {
            CreateData();
        }

        private string[] names = { "John", "Kim", "Sandy", "Mark", "Josh", "Jim", "Sam", "Mary", "Harry", "Sue", "Chris", "Joe", "Carl" };
        private void CreateData()
        {
            Random r = new Random();

            for (int j = 0; j <= 2; j++)
            {
                Data = new ObservableCollection<DataItem>();

                for (int i = 0; i <= 9; i++)
                {
                    Data.Add(new DataItem
                    {
                        ID = i,
                        Name = names[i],
                        Value1 = r.Next(1, 50),
                        Value2 = r.Next(1, 100)
                    });
                }
            }
        }
    }

    public class DataItem
    {
        public int ID { get; set; }
        public string Name { get; set; }
        public double Value1 { get; set; }
        public double Value2 { get; set; }
    }
Add an instance of the XamCategoryChart Control
To the layout root, add an instance of the data collection, a legend instance, and an instance of the XamCategoryChart:
In XAML
<ContentView x:Class="Samples.Browser.Views.DataCharts.Axes.ChartEditingCategoryAxes"
             xmlns="http://xamarin.com/schemas/2014/forms"
             xmlns:x="http://schemas.microsoft.com/winfx/2009/xaml"
             xmlns:ig="clr-namespace:Infragistics.XamarinForms.Controls.Charts;assembly=Infragistics.XF.Charts">
    <Grid >
        <ig:XamCategoryChart ItemsSource="{Binding}" XAxisLabel="{}{Name}" Margin="10" />
    </Grid>
</ContentView>
(Optional) Verify the Result
Run your application to verify the result. If you have successfully bound the XamCategoryChart control to the data collection, the resulting chart will look like the one shown in Figure 1, above.
Figure #2
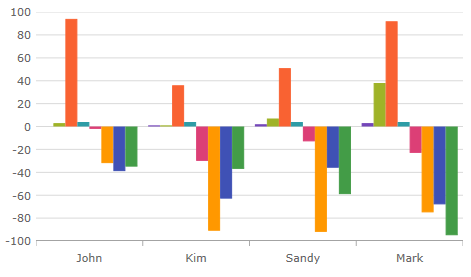
The XamCategoryChart control as implemented by the nested sample code. The positive values represent the parent data item’s properties and the negative values show the children property values.
Defining a Nested Data Model
Adding an Instance of the XamCategoryChart control
(Optional) Verifying the result
Define a Data Model
Create a class to model the data. The following code creates Parent and Child classes representing nested level collections, as well as a ViewModel class representing a collection of those pairs.
Prerequisites:
The “child-level” class must contain a numeric property.
The View Model must Implement ObservableCollection that is the type equal to your “parent-level” collection. This will allow you to add children objects.
The Parent class will implement IEnumerable.
In C#:
    public class ViewModel : ObservableCollection<Parent>
    {
        public ViewModel()
        {
            CreateData();
        }

        private string[] names = {"John","Kim","Sandy","Mark","Josh","Jim","Sam"};

        private void CreateData()
        {
            Random r = new Random();

            for (int j = 0; j <= 3; j++)
            {
                Parent dt = new Parent()
                {
                    ID = j,
                    Name = names[j],
                    Value1 = r.Next(1, 50),
                    Value2 = r.Next(1, 100),
                    Children = new ObservableCollection<Child>()
                };

                for (int y = 0; y <= 3; y++)
                {
                    Child children = new Child()
                    {
                        ID = y + 1,
                        Name = names[y],
                        Value2 = r.Next(-100, 0),
                    };

                    dt.Children.Add(children);
                }
                this.Add(dt);
            }
        }
    }

    public class Parent : IEnumerable
    {
        public ObservableCollection<Child> Children { get; set; }
        public double ID { get; set; }
        public string Name { get; set; }
        public double Value1 { get; set; }
        public double Value2 { get; set; }

        public IEnumerator GetEnumerator()
        {
            return this.Children.GetEnumerator();
        }
    }

    public class Child
    {
    	public double ID { get; set; }
        public string Name { get; set; }
        public double Value2 { get; set; }
    }
Add an instance of the XamCategoryChart Control
To the layout root, add an instance of the nested data collection and an instance of the Category Chart:
In XAML
<ContentPage x:Class="Samples.Browser.Views.DataCharts.Axes.ChartEditingCategoryAxes"
             xmlns="http://xamarin.com/schemas/2014/forms"
             xmlns:x="http://schemas.microsoft.com/winfx/2009/xaml"
             xmlns:ig="clr-namespace:Infragistics.XamarinForms.Controls.Charts;assembly=Infragistics.XF.Charts">
    <Grid>
        <ig:XamCategoryChart ItemsSource="{Binding}" XAxisLabel="{}{Name}" Margin="10" />
    </Grid>
</ContentPage>
(Optional) Verify the Result
Run your application to verify the result. If you have successfully bound the Category Chart control to the nested data collection, the resulting chart will look like the one shown in Figure 2, above.
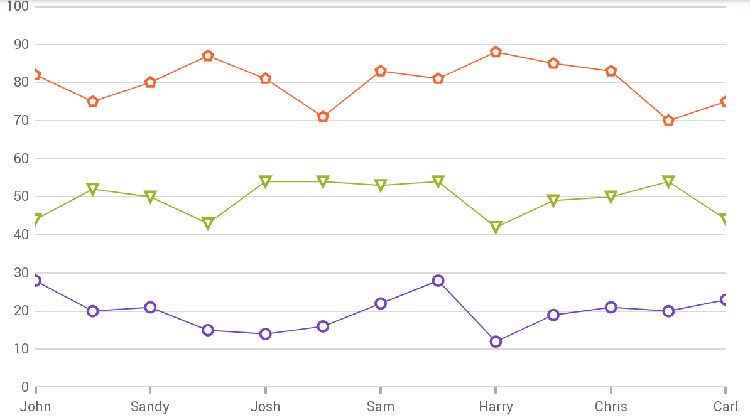
Figure #3
The XamCategoryChart as implemented with a collection of collections data source.
Defining a Data Model.
Adding an instance of the XamCategoryChart control.
(Optional) Verifying the result.
Defining a Data Model
Create a class to model the data. The following code creates a ViewModel class with a nested collection in the format of IList<IList<Type>> and populates it similar to the hierarchical data structure demonstrated above.
In C#
public class ViewModel
{
    public ObservableCollection<ObservableCollection<SampleData>> Data { get; set; }

    private string[] names = { "John", "Kim", "Sandy", "Mark", "Josh", "Jim", "Sam", "Mary", "Harry", "Sue", "Chris", "Joe", "Carl" };

    Random r = new Random();
    public ViewModel()
    {
        Data = new ObservableCollection<ObservableCollection<SampleData>>();

        for(int i=0; i<3; i++)
        {
            ObservableCollection<SampleData> innerData = new ObservableCollection<SampleData>();
            for(int j = 0; j <names.Length; j++)
            {
                SampleData sd = new SampleData() { Name = names[j] };

                if(i == 0)
                {
                    sd.Value = r.Next(10, 30);
                }
                else if(i == 1)
                {
                    sd.Value = r.Next(40, 60);
                }
                else
                {
                    sd.Value = r.Next(70, 90);
                }

                innerData.Add(sd);
            }
            Data.Add(innerData);
        }
    }
}

public class SampleData
{
    public string Name { get; set; }
    public int Value { get; set; }
}
Add an instance of the XamCategoryChart control To the layout root, add an instance of the XamCategoryChart, binding it to the IList<IList<Type>>.
In XAML
<ContentPage xmlns="http://xamarin.com/schemas/2014/forms"
             xmlns:x="http://schemas.microsoft.com/winfx/2009/xaml"
             xmlns:local="clr-namespace:MyAppNamespace"
             xmlns:ig="clr-namespace:Infragistics.XamarinForms.Controls.Charts;assembly=Infragistics.XF.Charts">
     <Grid>
        <Grid.BindingContext>
            <local:ViewModel />
        </Grid.BindingContext>

        <ig:XamCategoryChart ItemsSource="{Binding Data}"
                         ChartType="Line"
                         YAxisMinimumValue="0"
                         YAxisMaximumValue="100"/>
    </Grid>
</ContentPage>
(Optional) Verify the Result Run your application to verify the result. If you have successfully bound the XamCategoryChart to the IList<IList<Type>>, the resulting chart will look like the one shown in Figure 3, above.
The following topics provide additional information related to this topic: