Version

Series Trend Lines

This topic explains, with code examples, how to use the trend lines in the XamDataChart™ control.

Introduction

In the XamDataChart control, trend line is a line that helps identify a trend in data bound to a Series through its ItemsSource property.

Preview

Using xamDataChart Trend Lines 01.png

Figure 1 – Sample implementation of trend line in the Data Chart.

Supported Series

Most types of series provide support for plotting trend lines in the chart control and these series are listed in the following table.

Table 1 – Series that support trend lines

Note
Note:

The above table excludes all stacked and range series in the Category Series group and all overlay series in the Financial Series group because these types of series do not support trend lines.

Types of Trend Lines

The Data Chart supports the following types of trend lines through Series object’s TrendLineType property.

Table 2 – Types of trend lines.

Types of Trend Lines Description

None

Specifies no trend line on a series.

CubicFit

Specifies a cubic polynomial fit trend line on a series.

CumulativeAverage

Specifies a cumulative moving average trend line on a series.

ExponentialAverage

Specifies an exponential moving average trend line on a series.

ExponentialFit

Specifies an exponential fit trend line on a series.

LinearFit

Specifies a linear fit trend line on a series.

LogarithmicFit

Specifies a logarithmic fit trend line on a series.

ModifiedAverage

Specifies a modified moving average trend line on a series.

PowerLawFit

Specifies a power-law fit trend line on a series.

QuadraticFit

Specifies a quadratic polynomial fit trend line on a series.

QuarticFit

Specifies a quartic polynomial fit trend line on a series.

QuinticFit

Specifies a quintic polynomial fit trend line on a series.

SimpleAverage

Specifies a simple moving average trend line on a series.

WeightedAverage

Specifies a weighted moving average trend line on a series.

Trend Lines Properties

All properties of trend lines start with the "TrendLine" string and they are provided by each Series object.

Table 3 – Trend lines properties.

Property Name Property Type Description

Brush

Gets or sets the brush used to draw the trend line.

TrendLineType

Gets or sets the TrendLineType enumeration value that specifies which type of trend line will be displayed along the current series.

int

Gets or sets the moving average period for the current series object. This property is used only by the following types of trend lines:

ExponentialAverage

ModifiedAverage

SimpleAverage

WeightedAverage

double

Gets or sets the thickness of the current series object’s trend line.

Code Examples

This section provides code examples for using trend lines only with the Financial Price Series. However, the same logic can be applied to other series that support trend lines by replacing the FinancialPriceSeries object with other type of series.

Note
Note:

These code examples assume that you are familiar with using and binding data to the Financial Price Series. Refer to the Financial Series topic for more information on data requirements for this type of series and data bindings.

Display Trend Line

This code snippet demonstrates how to show the Weighted Moving Average trend line on the Financial Price Series using its TrendLineType property. Assigning different TrendLineType enumeration value to this property will change which trend line is displayed with the series.

In C#:

// create financial price series with a trend line
var series = new FinancialPriceSeries();
// ...
series.TrendLineType = TrendLineType.WeightedAverage;
series.TrendLinePeriod = 10;
// add a series to the chart
DataChart.Series.Add(series);
Using xamDataChart Trend Lines 02.png

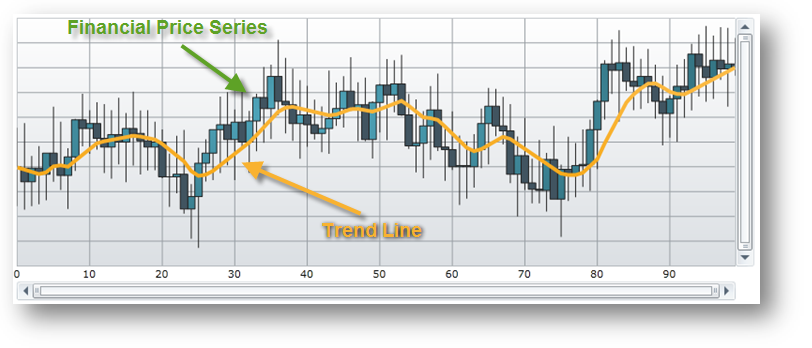
Figure 2 – Financial Price Series with Weighted Moving Average trend line in the Chart control.

Style Trend Line

This code snippet demonstrates how to style a trend line.

In C#:

// create financial price series with and style its trend line
var series = new FinancialPriceSeries();
// ...
series.TrendLineBrush = new SolidColorBrush(Colors.Orange);
series.TrendLineThickness = 5.0;
// add a series to the chart
DataChart.Series.Add(series);
Using xamDataChart Trend Lines 03.png

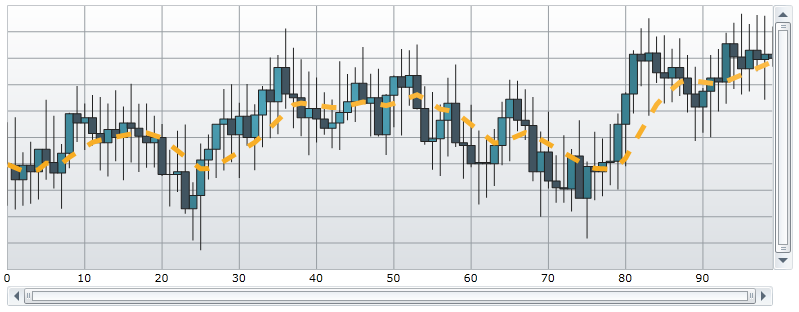
Figure 3 – Financial Price Series with styled trend line in the Data Chart.