<ig:XamDataChart x:Name="chart">
    <ig:XamDataChart.Axes>
        <ig:OrdinalTimeXAxis x:Name="xAxis" ItemsSource="{Binding Data}" DateTimeMemberPath="Date">
    </ig:XamDataChart.Axes>
</ig:XamDataChart>
This topic demonstrates, with code examples, how to use the OrdinalTimeXAxis in the XamDataChart control. The benefit of using this axis is to dynamically change DateTime label formats as you zoom in or out of your data.
The OrdinalTimeXAxis may be used with the following series:
The main difference between the OrdinalTimeXAxis and the TimeXAxis is that in the ordinal axis, the dates displayed are assumed to be equidistant. The TimeXAxis currently sorts and aligns them according to a chronological timescale.
Below is a code example on how to add the OrdinalTimeXAxis to the chart:
In XAML:
<ig:XamDataChart x:Name="chart">
<ig:XamDataChart.Axes>
<ig:OrdinalTimeXAxis x:Name="xAxis" ItemsSource="{Binding Data}" DateTimeMemberPath="Date">
</ig:XamDataChart.Axes>
</ig:XamDataChart>In C#:
var dataChart = new XamDataChart();

var ordinalAxis = new OrdinalTimeXAxis();
ordinalAxis.ItemsSource = data;
ordinalAxis.DateTimeMemberPath = "Date";

dataChart.Axes.Add(ordinalAxis);
In Visual Basic:
Dim dataChart As XamDataChart = New XamDataChart()
Dim ordinalAxis As OrdinalTimeXAxis = New OrdinalTimeXAxis()
ordinalAxis.ItemsSource = data
ordinalAxis.DateTimeMemberPath = "Date"
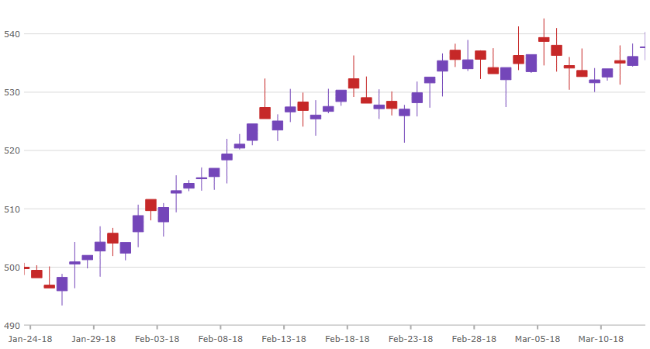
dataChart.Axes.Add(ordinalAxis)Below is a screenshot demonstrating the usage of the OrdinalTimeXAxis with a FinancialPriceSeries:
The OrdinalTimeXAxis has the LabelFormats property which is a collection of type TimeAxisLabelFormat. Each TimeAxisLabelFormat added to the collection is responsible for assigning a unique Format and Range. This can be especially useful for drilling data from years to milliseconds and adjusting the labels depending on the range of time shown by the chart.
The following lists a typical set of label formats for the given amount of time in view:
1825 days or more (eg. 5 years) will result in a format of "yyyy".
365 days or more (eg. 1 year) will result in a format of "MMM yy".
1 day or more will result in a format of "MMM-dd-yy".
5 hours or more will result in a format of "hh:mm".
Below 5 hours will result in a format of "hh:mm:ss".
In XAML:
<ig:XamDataChart x:Name="DataChart" >
    <ig:XamDataChart.Axes>
       <ig:OrdinalTimeXAxis x:Name="xAxis" ItemsSource="{StaticResource data}" DateTimeMemberPath="Date" >
            <ig:OrdinalTimeXAxis.LabelFormats>
                    <ig:TimeAxisLabelFormat
                        Format="hh:mm:ss"
                        Range="0.00:00:00"/>
                    <ig:TimeAxisLabelFormat
                        Format="hh:mm"
                        Range="0.05:00:00"/>
                    <ig:TimeAxisLabelFormat
                        Format="MMM-dd-yy"
                        Range="1.00:00:00" />
                    <ig:TimeAxisLabelFormat
                        Format="MMM yy"
                        Range="365.0:00:00" />
                    <ig:TimeAxisLabelFormat
                        Format="yyyy"
                        Range="1825.0:00:00" />
            </ig:OrdinalTimeXAxis.LabelFormats>
        </ig:OrdinalTimeXAxis>
    </ig:XamDataChart.Axes>
</ig:XamDataChart>
In C#:
var DataChart = new XamDataChart();
var ordinalTimeXAxis = new OrdinalTimeXAxis();
DataChart.Axes.Add(ordinalTimeXAxis);

var axisFormat = ordinalTimeXAxis.LabelFormats;

axisFormat.Add(new TimeAxisLabelFormat
{
    Format = "hh:mm:ss",
    Range = new TimeSpan(0, 0, 0, 0, 0)
});

axisFormat.Add(new TimeAxisLabelFormat
{
    Format = "hh:mm",
    Range = new TimeSpan(0, 5, 0, 0, 0)
});

axisFormat.Add(new TimeAxisLabelFormat
{
    Format = "MMM-dd-yy",
    Range = new TimeSpan(1, 0, 0, 0, 0)
});

axisFormat.Add(new TimeAxisLabelFormat
{
    Format = "MMM yy",
    Range = new TimeSpan(365, 0, 0, 0, 0)
});

axisFormat.Add(new TimeAxisLabelFormat
{
    Format = "yyyy",
    Range = new TimeSpan(1825, 0, 0, 0, 0)
});
In Visual Basic:
Dim DataChart = New XamDataChart()
Dim ordinalTimeXAxis = New OrdinalTimeXAxis()
DataChart.Axes.Add(timeXAxis)
Dim axisFormat = ordinalTimeXAxis.LabelFormats
axisFormat.Add(New TimeAxisLabelFormat() With { _
.Format = "hh:mm:ss", _
.Range = New TimeSpan(0, 0, 0, 0, 0) _
})
axisFormat.Add(New TimeAxisLabelFormat() With { _
.Format = "hh:mm", _
.Range = New TimeSpan(0, 5, 0, 0, 0) _
})
axisFormat.Add(New TimeAxisLabelFormat() With { _
.Format = "MMM-dd-yy", _
.Range = New TimeSpan(1, 0, 0, 0, 0) _
})
axisFormat.Add(New TimeAxisLabelFormat() With { _
.Format = "MMM yy", _
.Range = New TimeSpan(365, 0, 0, 0, 0) _
})
axisFormat.Add(New TimeAxisLabelFormat() With { _
.Format = "yyyy", _
.Range = New TimeSpan(1825, 0, 0, 0, 0) _
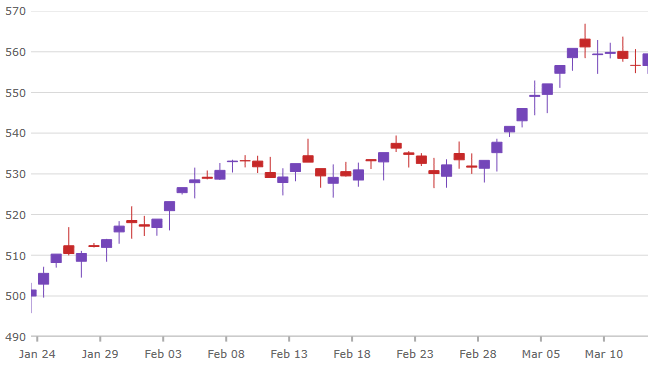
})Below is a screenshot demonstrating the usage of the OrdinalTimeXAxis with a FinancialPriceSeries with label formatting: