xmlns:ig="http://schemas.infragistics.com/xaml"
This topic explains how to add the XamLinearGauge™ control to an WPF application.
The following topics are prerequisites to understanding this topic:
This topic contains the following sections:
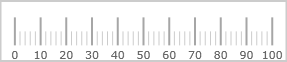
To add XamLinearGauge to a page, you need to create an instance of the control and add it to your page’s root element. The control is pre-configured to display a scale with values varying from 0 to 100, major and minor tick marks, and, by default, it takes the size of the container it is placed into.
Add the following NuGet package to your main project:
Infragistics.WPF.Gauges
For more information on setting up the NuGet feed and adding NuGet packages, you can take a look at the following documentation: NuGet Feeds.
Also, add the following Infragistics namespaces:
In XAML:
xmlns:ig="http://schemas.infragistics.com/xaml"In C#:
using Infragistics.Controls.Gauges;In VB:
Imports Infragistics.Controls.GaugesFollowing are the general conceptual steps for adding XamLinearGauge .
1. Adding the XamLinearGauge control
2. Configuring the scale
3. Configuring the needle
4. Configuring additional aspects (For details, see Adding XamLinearGauge – Code Example and Configuring XamLinearGauge .)
The following procedure walks through instantiating a XamLinearGauge control, adding it to a WPF application, and configuring a needle, and three comparative ranges on the scale.
The following screenshot is a preview of the final result.
To complete the procedure, you need the following:
A WPF project with a page
The required assembly references and namespaces added to the project (See Requirements.)
Following is a conceptual overview of the process:
1. Adding the XamLinearGauge control
2. Configuring the scale
3. Configuring the needle
4. Adding comparative ranges
The following steps demonstrate how to add the XamLinearGauge control to an application.
Add a XamLinearGauge declaration to your page’s root Grid element and set its desired * Height *and Width .
In XAML:
<ig:XamLinearGauge x:Name="linearGauge"
                    Height="70" Width="300" />
In C#:
var linearGauge = new XamLinearGauge();
linearGauge.Height = 70;
linearGauge.Width = 300;
In Visual Basic:
Dim linearGauge As New XamLinearGauge
With linearGauge
      .Height = "70"
      .Width = "300"
 End With
This declaration would instantiate XamLinearGauge with its default look and settings and fixed size. This means that the scale would display the 0-100 range with major and minor tick marks so it would need some additional configuring.
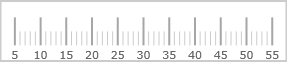
In order to customize the values of the scale, you need to set its MinimumValue and MaximumValue properties . In this example, the scale will start at 5 and end at 55.
In XAML:
<ig:XamLinearGauge x:Name="linearGauge"
                   ...
                   MinimumValue="5"
                   MaximumValue="55">
</ig:XamLinearGauge>
In C#:
linearGauge.MaximumValue = 55;
linearGauge.MinimumValue = 5;
In Visual Basic:
.MinimumValue = "5"
.MaximumValue = "55"
The changed scale is shown on the following screenshot:
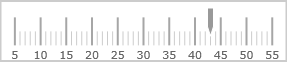
To position the needle on the scale is managed by the value of the TargetValue property. For this example, set the Value property to 43.
In XAML:
<ig:XamLinearGauge x:Name="linearGauge"
                   ...
                 Value="43">
</ig:XamLinearGauge>
In C#:
linearGauge.Value = 43;In Visual Basic:
.Value = "43"The following screenshot displays what the XamLinearGauge control would look so far in the procedure.
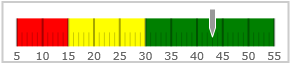
In order to compare the value displayed by the performance bar against some meaningful range(s) of values, these comparative ranges need to be displayed on the scale. Comparative ranges are managed by Ranges property within which several individual XamLinearGraphRanges can be defined, each of which having its own starting and ending values (StartValue and EndValue) and color (Brush).
For this example, configure 3 comparative ranges, each of a different shade of gray, starting at the 0, 15, and 30 tick marks of the scale, respectively.
In XAML:
<ig:XamLinearGauge x:Name="linearGauge"
                   ...
                   >
                   <ig:XamLinearGauge.Ranges>
                        <ig:XamLinearGraphRange StartValue="0"
                                     EndValue="15"
                                     Brush="Red"/>
                        <ig:XamLinearGraphRange StartValue="15"
                                     EndValue="30"
                                     Brush="Yellow"/>
                        <ig:XamLinearGraphRange StartValue="30"
                                     EndValue="55"
                                     Brush="Green"/>
                   </ig:XamLinearGauge.Ranges>
</ig:XamLinearGauge>
In C#:
var range1 = new XamLinearGraphRange();
   range1.StartValue = 0;
   range1.EndValue = 15;
   range1.Brush = new SolidColorBrush(Color.FromRgb(250, 0, 0));
var range2 = new XamLinearGraphRange();
   range2.StartValue = 15;
   range2.EndValue = 30;
   range2.Brush = new SolidColorBrush(Color.FromRgb(255, 255, 0));
var range3 = new XamLinearGraphRange();
   range3.StartValue = 30;
   range3.EndValue = 55;
   range3.Brush = new SolidColorBrush(Color.FromRgb(0, 153, 0));
linearGauge.Ranges.Add(range1);
linearGauge.Ranges.Add(range2);
linearGauge.Ranges.Add(range3);
In Visual Basic:
Dim range As New XamLinearGraphRange
 With range
      .Brush = New SolidColorBrush(Color.FromRgb(255, 0, 0))
      .StartValue = 0
      .EndValue = 15
 End With
Dim range2 As New XamLinearGraphRange
 With range2
      .Brush = New SolidColorBrush(Color.FromRgb(255, 255, 0))
      .StartValue = 15
      .EndValue = 30
 End With
Dim range3 As New XamLinearGraphRange
 With range3
      .Brush = New SolidColorBrush(Color.FromRgb(0, 255, 0))
      .StartValue = 30
      .EndValue = 55
 End With
The final look of the graph is presented below.
The following topics provide additional information related to this topic.