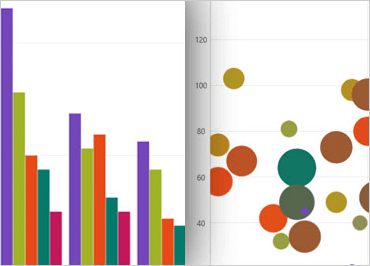
Data Chart
If your UWP app needs to process thousands of rows of complex data with speed and agility, our Data Chart is the answer. This control is packed with the tools you need to create engaging experiences.
Learn More
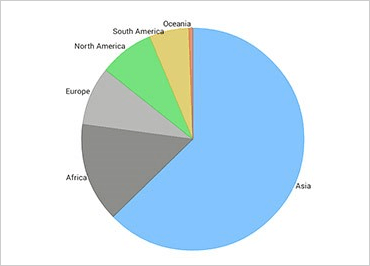
Pie Chart
Create simple or exploded pie charts, text labels, and images that can be displayed within or outside of the pie in a manner that avoids overlapping. Users can then drill down to view underlying data, explode out a section of the pie, and find information via tooltips.
Learn More
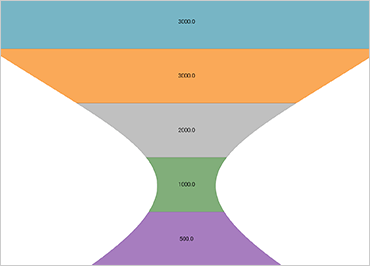
Funnel Chart
Showcase diminishing values with this single series chart that displays data in a funnel shape. A variable number of sections represent the data as different portions of 100%. End users can easily illustrate value "fallout" in the sales process or bottlenecks in the flow of a multi-step process.
Learn More