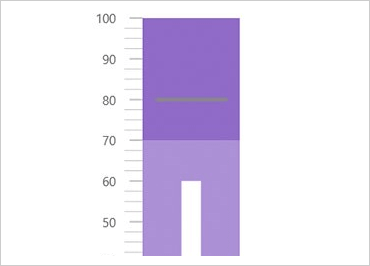
UWP Bullet Graph
Deliver a simple, concise view of key performance indicators (KPI) to users. Present progress towards goals and good/better/best ranges in minimal horizontal or vertical space.
Configurable Orientation and Direction
Easily switch between horizontal and vertical orientation.

Configurable Visual Elements
Each of the visual elements of the bullet graph (such as the performance bar, comparative marker, ranges, tick marks, scale, labels, border, and background) can be configured in several aspects.
