Bullet Graph
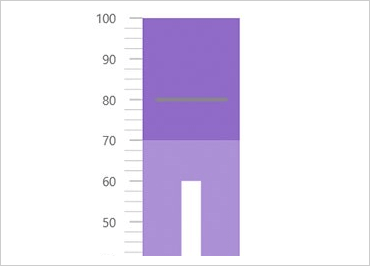
Deliver a simple, concise view of key performance indicators (KPI) to users. Present progress towards goals and good/better/best ranges in minimal horizontal or vertical space.
Learn More
Linear Gauge
Make your data visualizations and dashboards more engaging with a Linear Gauge that shows off KPIs with rich style and interactivity. The gauges are powerful, easy to use, highly configurable, and present an endless variety of dashboards.
Learn More
Radial Gauge
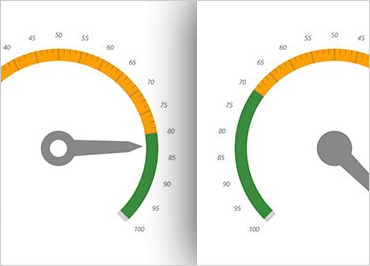
These round and semi-round gauges are powerful, easy to use, and highly configurable to present dashboards that can display clocks, industrial panels, automotive dashboards, and even aircraft cockpits.
Learn More