UWP Data Chart
If your UWP app needs to process thousands of rows of complex data with speed and agility, our Data Chart is the answer. This control is packed with the tools you need to create engaging experiences.
All Screens, Superior Charting
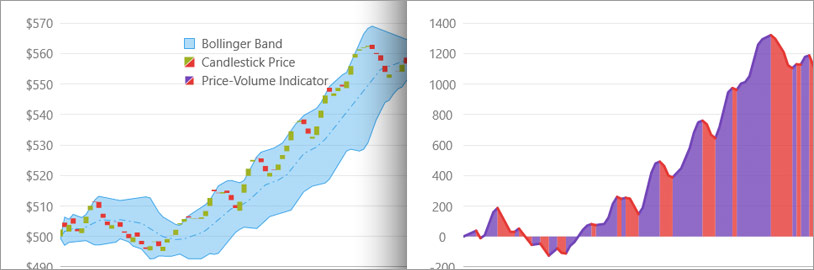
Easily build complete mobile analytical solutions with Candlestick, OHLC bar charts, and many built-in technical indicators like Wilder's RSI, MACD, a money flow index, Bollinger bands, moving averages, and more.
Modular Design
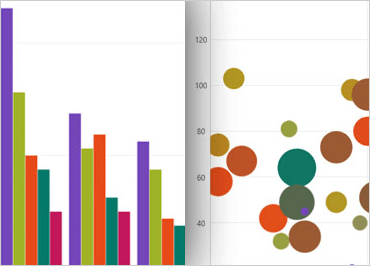
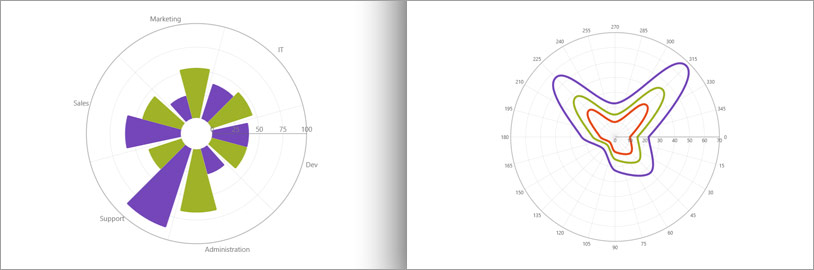
Build charts that incorporate multiple chart layers, multiple chart areas, and multiple axes.
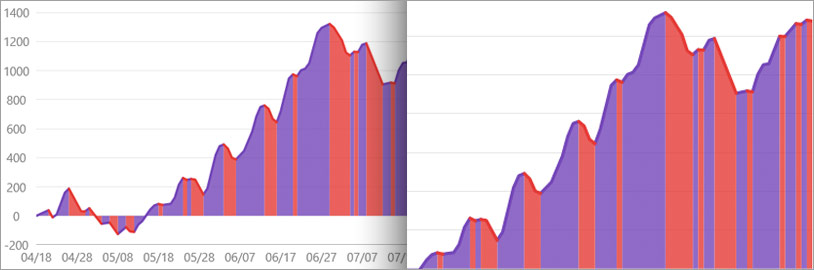
High-Performance Rendering
The UWP Data Chart is built to take on your most complex data. Real-time feeds are easily processed when you design your chart to update itself frequently.
Highly Customizable
Enhance and customize your charts with popular features including Axis titles, labels, gridlines, markers, tooltips, and legends.
Panning and Zooming
Users can easily explore their data with touch gestures like drag, pinch, and double tap.
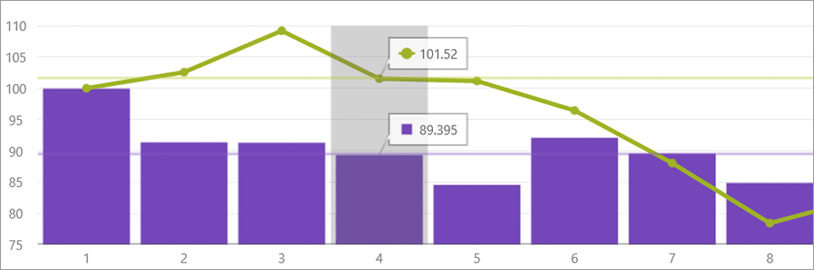
Annotation Layers
These interactive features of the data chart appear when a user performs a tap and/or drag gesture. The features are then laid on top of the chart series to display or highlight information about data in the form of crosshairs, tooltips, or highlighted columns and markers.