
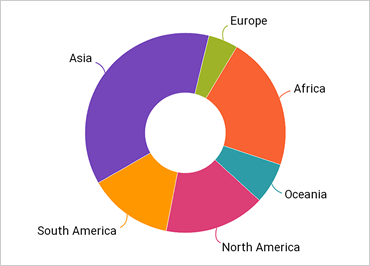
Xamarin Doughnut Chart
The Xamarin Doughnut Chart displays multiple series using concentric rings, each of which represents a data series. Similar to a Pie Chart, the Doughnut Chart shows categorical statistics expressed in percentages. Easily configure the boundary of the hollow center, which can be left empty or labeled. Bind easily to data, display exploded slices, customize themes, and more with this well-rounded control.
Learn More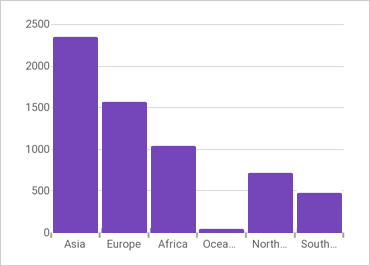
Xamarin Category Chart
This touch-enabled charting control makes visualizing category-based data a breeze. Built on the industry’s best-performing, feature-rich data chart, the category chart filters the complexities of data visualization into a simplified API that anyone can use.
Learn More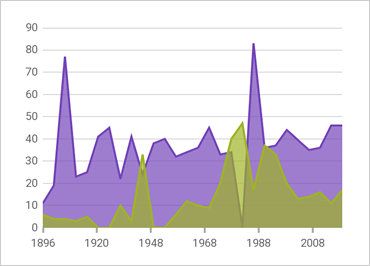
Xamarin Data Chart
Use the Xamarin Data Chart control to display your data in multiple series and types, with animated transitions, and with modular design capabilities for legend, axis, markers, series, trend lines, and interaction layers.
Learn More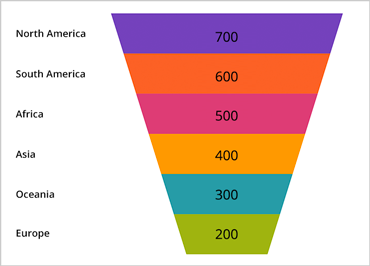
Xamarin Funnel Chart
Visually showcase diminishing values with our new Funnel Chart control, a single-series chart that displays data in a funnel shape with a variable number of sections, each representing the data as different portions of 100%. The funnel chart makes it easy for end users to illustrate value "fallout" in the sales process or bottlenecks in the flow of a multi-step process.
A funnel chart displays quantities as percentages of a whole, much like a pie chart. Funnel charts are commonly used to display quantitative data in relation to stages of a process. For example, a funnel chart might display expenses of a product from the manufacturing stage to the actual sale of that product.
Learn More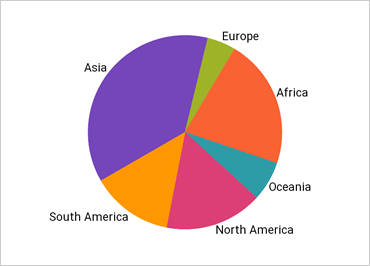
Xamarin Pie Chart
Use the Pie Chart control to drill down with tap gestures, view underlying data, or explode a pie section. Create simple or exploded pie charts with a customizable threshold for inclusion in an "Others" category. Display text labels within or outside of the pie without overlapping.
Use the new Ultimate UI for Xamarin Pie Chart Configurator to quickly configure the control and bind data directly from XAML—no code required!
Learn More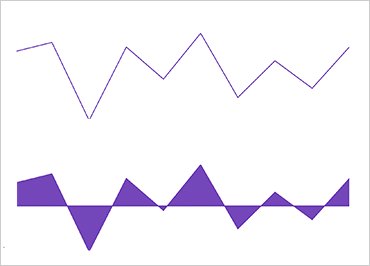
Xamarin Sparkline Chart
The Sparkline control is a data-intense, design-simple graphic that allows end users to spot trends, variations, and data patterns in a clear and compact representation. It is intended for rendering in a small-scale layout such as a grid cell, but can also be rendered as a standalone control.
Learn More