• North American Sales: 1-800-231-8588
  • Global Contacts
  • My Account
Infragistics logo Infragistics logo
Menu
  • North American Sales: 1-800-321-8588
  • My Account
    • Sign In/Register
  • Design & DevelopmentDesign & Develop
    • Best Value Bundles
      Infragistics Ultimate $1,099 The only complete UX/UI toolkit for building high performance, modern web, mobile and desktop applications.
      Infragistics Professional $999 The comprehensive UI components library for web, mobile and desktop developers.
      Ignite UI $849 A complete library of UI components for building modern, data-rich and responsive web apps.
    • Web
      Indigo.Design App Builder (New) Ignite UI Ignite UI for Angular Ignite UI for ASP.NET Core Ignite UI for ASP.NET MVC Ignite UI for Blazor Ignite UI for jQuery Ignite UI for React Ignite UI for Web Components Ultimate UI for ASP.NET Web Forms
    • Desktop
      Ultimate UI for Windows Forms Ultimate UI for WPF
      Cross Platform
      Ultimate UI for Uno Ultimate UI for UWP Ultimate UI for WinUI Ultimate UI for Xamarin
    • Design to Code
      Indigo.Design Indigo.Design App Builder (New)
      Automated Testing Tools
      Test automation for Micro Focus UFT: Windows Forms Test automation for Micro Focus UFT: WPF Test automation for IBM RFT: Windows Forms
  • UX
    • Indigo.Design A Unified Platform for Visual Design, UX Prototyping, Code Generation, and App Development
    • Indigo.Design App Builder Cloud-based WYSIWYG Drag & Drop Tool, Endless Theming options and Standards-Based Code Output
  • Business Intelligence
    • Reveal Embedded Analytics Easily embed beautiful data visualizations into your apps
    • Reveal App Empower everyone in your organization to use data to make smarter business decisions
  • Team Productivity
  • Learn & SupportSupport
    • Help & Support Documents
    • Blogs
    • Forums
    • Product Ideas
    • Reference Applications
    • Customer Stories
    • Webinars
    • eBook & Whitepapers
    • Events
  • Free Trials
  • Pricing
    • Product Pricing / Buy Online
    • Contact Us
 
Xamarin | Controls
  • Download Trial
Your Privacy Matters: We use our own and third-party cookies to improve your experience on our website. By continuing to use the website we understand that you accept their use. Cookie Policy
Close
  • Grids & Lists
    • Data Grid
  • Charts
    • Doughnut Chart
    • Category Chart
    • Data Chart
    • Funnel Chart
    • Pie Chart
    • Sparkline
  • Barcodes
    • QR Barcode
  • Frameworks
    • Excel Library
  • Gauges
    • Bullet Graph
    • Linear Gauge
    • Radial Gauge
  • Productivity Pack
    • App Map
    • Xamarin.Forms Toolbox
    • Configurators
  • Scheduling
    • Schedule
Xamarin Funnel Chart

Xamarin Funnel Chart

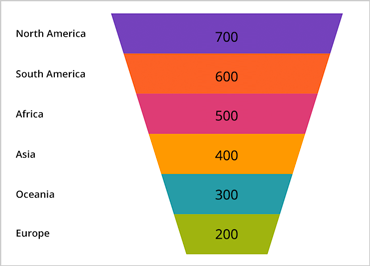
Visually showcase diminishing values with our new Funnel Chart control, a single-series chart that displays data in a funnel shape with a variable number of sections, each representing the data as different portions of 100%. The funnel chart makes it easy for end users to illustrate value "fallout" in the sales process or bottlenecks in the flow of a multi-step process.

A funnel chart displays quantities as percentages of a whole, much like a pie chart. Funnel charts are commonly used to display quantitative data in relation to stages of a process. For example, a funnel chart might display expenses of a product from the manufacturing stage to the actual sale of that product.
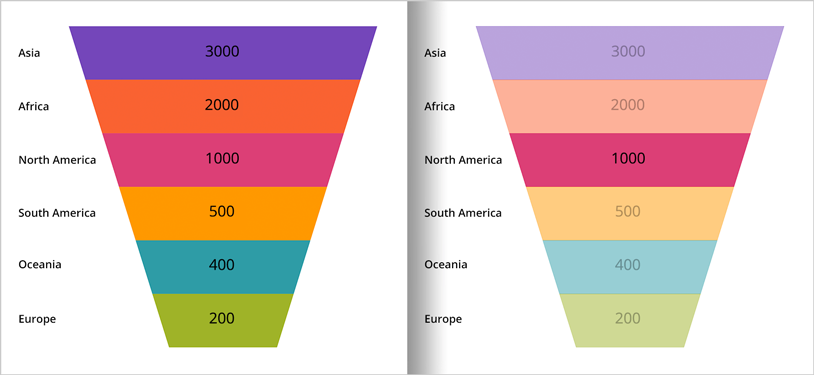

Slice Selection

Like the Ultimate UI for Xamarin Pie Chart, the Funnel Chart allows users to select individual slices of the funnel. This enables your users to interact with the funnel chart in a variety of ways, including firing events that your application can act on.

Xamarin Funnel Chart: Slice Selection

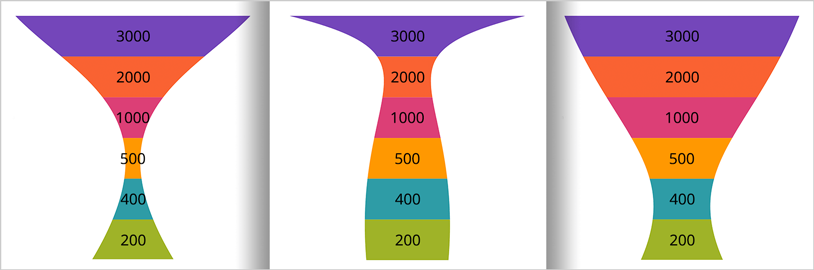
Inverted & Arc Funnel

Invert the funnel to display it as a pyramid, or make the funnel sides curve in or out on a Bezier curve.
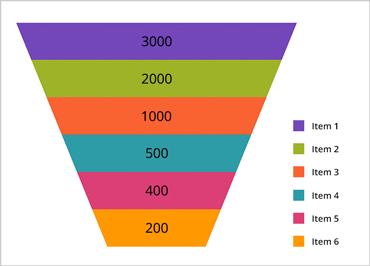
Xamarin Funnel Chart: Inverted and Arc Funnel

Xamarin Funnel Chart: Legend Support

Legend Support

The Funnel Chart includes a legend feature, in which each legend item corresponds to a single colored section of the funnel. The legend can be configured and docked to any of the chart's corners or borders.

  • Products
    • Design & Development
    • UX Pros
    • Business Intelligence
    • Team Productivity
    • View All
    • Free Trials
  • Learn & Support
    • Help & API Docs
    • Blogs
    • Technical Support Chat
    • Forums
    • Product Ideas
    • Submit a Request
  • My Account
    • Manage My Subscriptions
    • Support Requests
  • Corporate
    • About Us
    • Careers
    • Legal
    • News & Events
    • Partners
Stay Up-to-Date

Get the latest blogs, eBooks, events, and whitepapers.

Sign Me Up!
  • Privacy Policy(updated)
  • Cookies
  • Terms of Use(updated)
NEW Infragistics Ultimate 20.2 - Try free for 30 days!
Download Now
© Copyright 2021 INFRAGISTICS. All Rights Reserved
Back to top of page