Xamarin Data Chart
Use the Xamarin Data Chart control to display your data in multiple series and types, with animated transitions, and with modular design capabilities for legend, axis, markers, series, trend lines, and interaction layers.
Check the Visual Studio Marketplace to ensure you have the latest update.
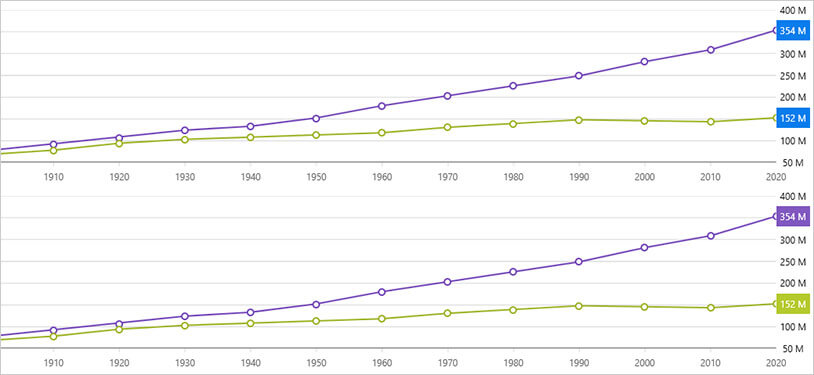
Animated Transitions
Choose from eighteen different animated entrance transitions based on the movement and direction of animated data points. Transitions include accordion from side or axis, expansion from value midpoints, zero value or reference value, sweep from side or axis, and more. Once displayed, you can also add transitions with easing functions to bring your data to life.
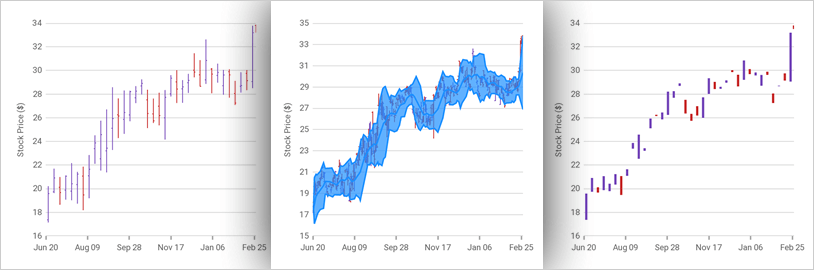
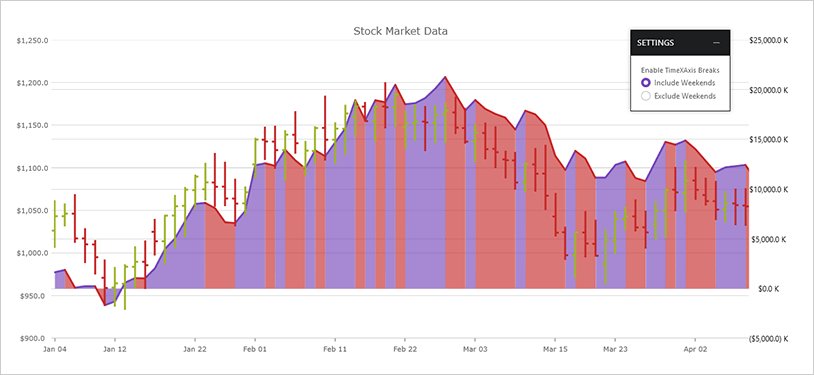
Financial Series
Take control of your financial charting scenarios with support for both Candlestick and OHLC bar charts, as well as built-in technical indicators like Moving Averages, Bollinger Bands, Money Flow Index, MACD, Wilder's RSI and many more.
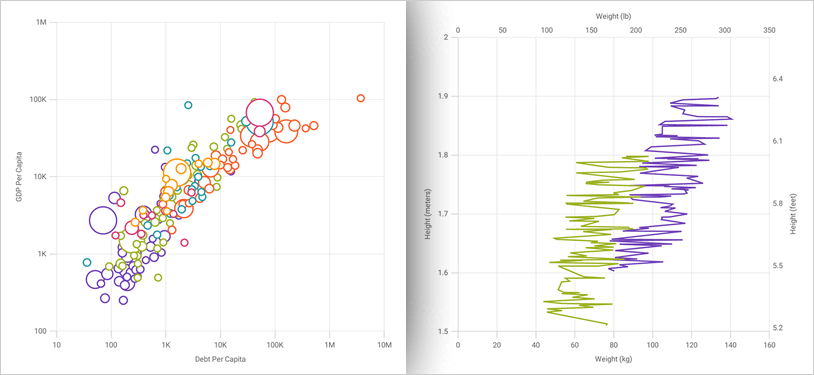
Scatter Series
Create scientific charts to show relationship among items in distinct data sets or plot data items using x and y coordinates. The Scatter Series let you draw attention to uneven intervals or clusters of data and can highlight the deviation of collected data from predicted results. You can use Scatter Series to organize data chronologically--even if the data is not in chronological order.
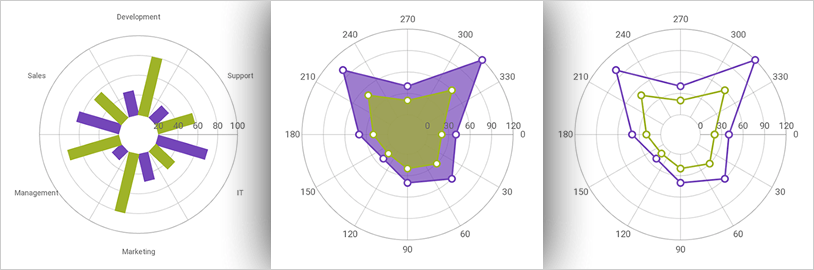
Polar Series
Create unique polar charts and plot data in polar (angle, radius) coordinate system instead of the Cartesian (x, y) coordinate system to show the relationship among items in distinct data sets that have directional components such as wind direction and speed, magnetic field strength and direction, or solar system object location.
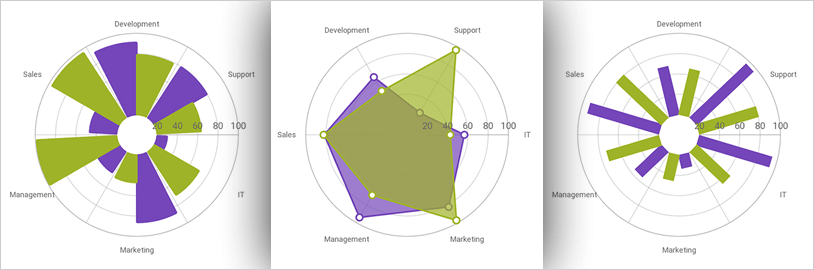
Radial Series
Create radial charts to show data value extension from a center or chart outwards rather than plotting data in the standard (x, y) coordinate system. Use these chart series to show and compare financial data in new and interesting ways.
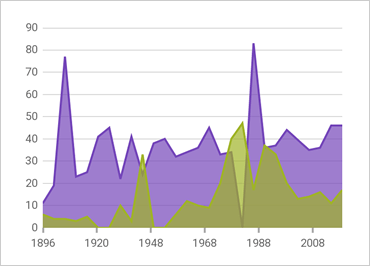
Axis Annotations
Add annotations to each value overlay and customize the background, foreground, outline, and stroke thickness for all chart layers. This can help you to emphasize and clearly visualize important trends and datapoints.
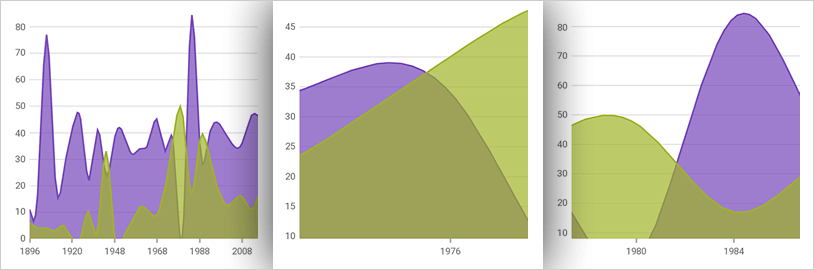
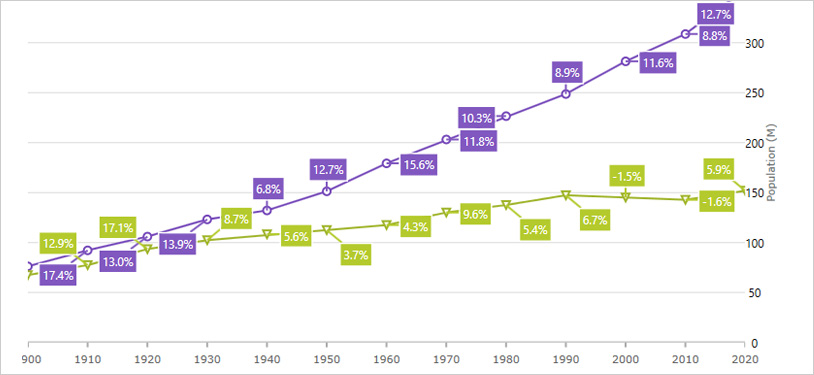
Callout Layer
Annotate important data points or display their values. Callouts Layer can target multiple data series or individual data series. Also, you can customize appearance of these callout layers and bind callout labels to data items or calculate changes between consecutive data points.
Final Values Layer
This annotation layer shows values of the last data point in your data source(s). The annotation is rendered as a colored box for each data source over the Y-Axis labels.