

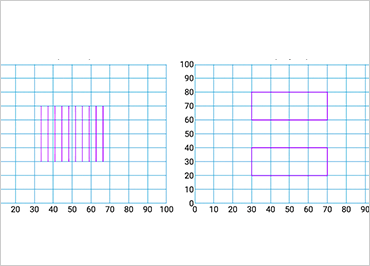
Ignite UI Shape Chart
The Ignite UI Shape Chart is a lightweight, high-performance chart that can be easily configured to display scatter data using a simple and intuitive API. Just bind your X/Y data as an array, or as an array of arrays, and the chart does the rest. The smart data adapter analyzes bound data and selects the appropriate visualization; for example, a set of three numeric data columns will automatically be plotted as a bubble chart. You can also specify the chart type using the ChartType option; choose from Point, Bubble, Area, Contour, High Density, Line Spline, Polyline, or Polygon.
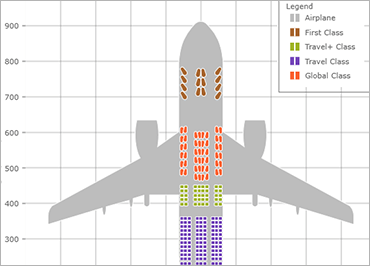
Render Break-Even Data
In addition, the Shape Chart can render break-even data if at least one data item has FixedCost, VariableCost, SalesRevenue, and SalesUnits data columns.