
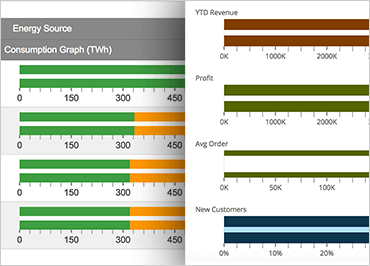
Ignite UI Bullet Graph
The Ignite UI Bullet Graph control displays values along a continuum. This visualization allows you to display positive or negative progress towards a target. The Bullet Graph is great for showing progress towards a goal, such as KPI’s or status bars for tasks in your application. Ignite UI’s Bullet Graph offers the most complete range of customization options, including custom scale and tick mark settings, custom range settings, animation, and vertical display.
View SamplePerformance Bar Settings
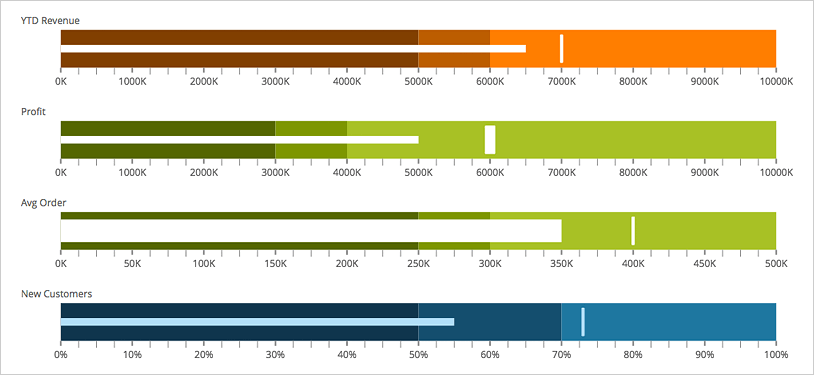
Ignite UI’s Bullet Graph control provides you with a unique way of visualizing performance data. With a couple of simple configuration settings, you can specify a target on your graph, allowing your users to see progress towards that target.
 View Sample
Grid Integration
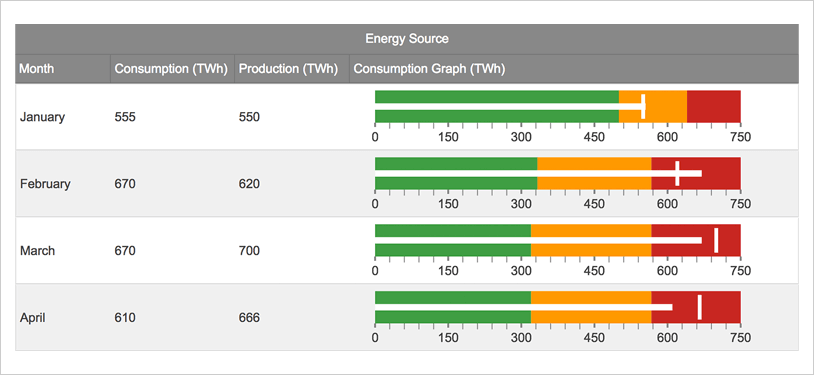
On its own, Ignite UI’s Bullet Graph control is a very user-friendly way to visualize data. When coupled with Ignite UI’s Grid control, it provides even more flexibility and opportunities to present your data in intuitive and inventive ways.
 View Sample