
Ignite UI Spreadsheet
The Spreadsheet component provides users with a powerful yet familiar way to manage data. The Spreadsheet component is supported by the Infragistics JavaScript Excel library, enabling it to import and export data to and from Microsoft Excel files either locally or from a service. The Spreadsheet supports all basic spreadsheet features, including workbooks, worksheets, cells, formulas, and more.
View Sample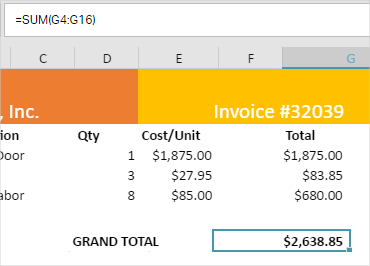
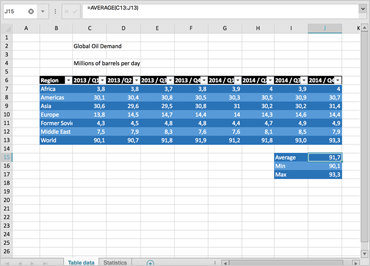
Formula Bar
The most powerful feature of any spreadsheet is the ability to create formulas based on the spreadsheets data. The Spreadsheet component includes a formula bar that allows users to see formula definitions. The Spreadsheet component supports custom formulas and provides dozens of built-in functions, including simple formulas such as SUM, MEAN, and MEDIAN, in addition to more complex formulas such as GEOMEAN and HARMEAN. The Formula Bar is also resizable, making it easier to see long or complex formulas.
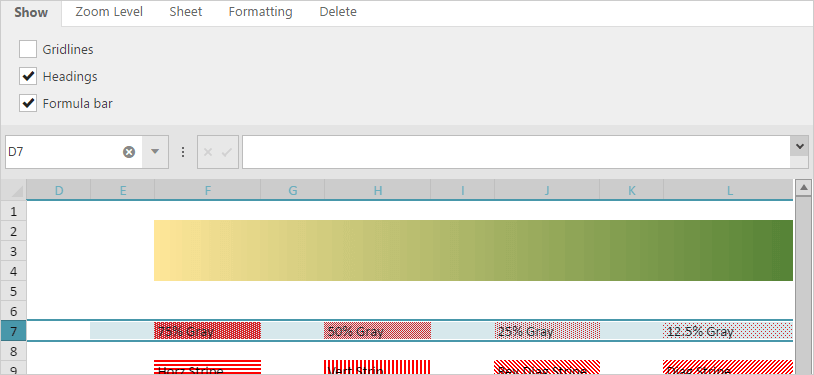
Configurable View
The Spreadsheet component provides many options to manage how users work with and consume the data presented to them. You can programmatically hide the gridlines, headings, and the formula bar. The spreadsheet also supports zooming and text formatting (bold, italics, underline). These features work in real-time, so your users can change these settings on the fly. Users can also split the spreadsheet into scrollable panes and freeze the first column or row.
 View Sample
Import and Save Data to Excel
The Spreadsheet component leverages the power of the Infragistics JavaScript Excel library to enable your users to import and export data to and from Microsoft Excel files. Users can import data from an Excel file, or you can programmatically generate a workbook data object and display it in the spreadsheet. Similarly, users can export data from your web-based app and either save it to a local file or stream it to a remote computer. The Spreadsheet component supports all Excel formulas, as well as Excel structural features, such as workbooks and worksheets. The excel engine supports more than 100 functions.
View Sample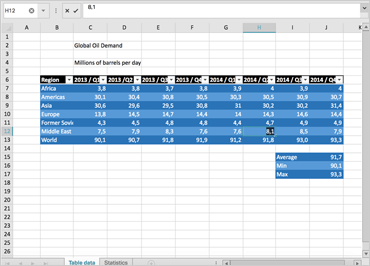
Excel Editing and Formatting
The igSpreadsheet is built on top of our existing Excel framework and provides an interactive control to our powerful Excel document capabilities. Editing and cell formatting features include conditional formatting, and sorting and filtering, all without requiring Excel to be installed.
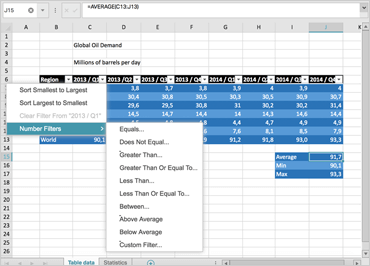
Worksheet Sorting and Filtering
Table and worksheet-level sorting and filtering capabilities let you define and sort or filter an area by text, number, date, or color formatting within a worksheet or outside a table. Choose from a list of filters or create specific filters to customize your view. With the Custom Sort Dialog, Top 10 Filter Dialog, and Format Cells Dialog, you can secondary sort, sort by the top ten (or bottom ten) records, and adjust the way a spreadsheet displays data in a cell. You can also choose from a list of filters or create customized ones.
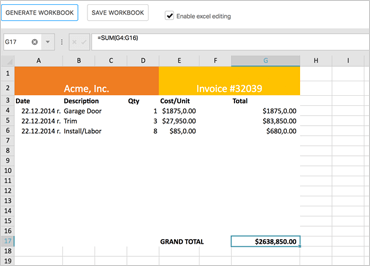
Table Creation and Management
Improved features let you copy and paste entire tables, expand and edit tables, navigate between rows, choose common formulas, and use the context menu to add rows, columns, and data to a table.
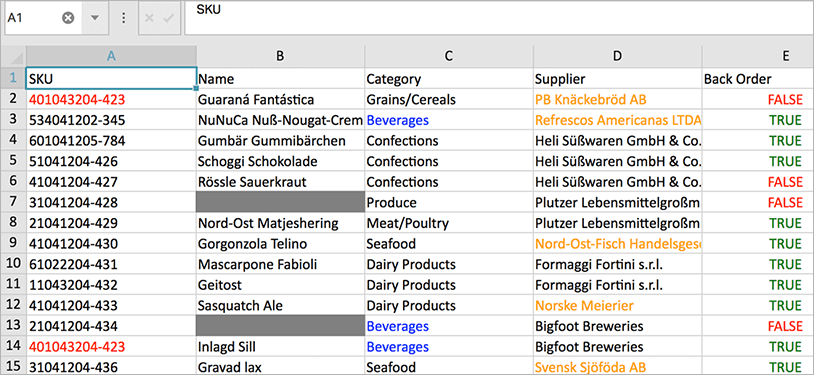
Conditional Formatting
Render all the conditional formatting features available in Microsoft Excel, including presets for data bars, color scales with two- or three-color gradients, and icons.
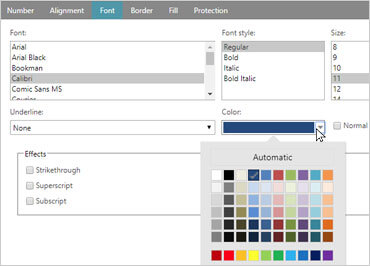
Format Cells Dialog
Right-click on a cell to use the Format Cells dialog box to format cell data. Modify number display, alignment, font, shading and borders, and protection of your worksheet data.