

Ignite UI for jQuery Gauges
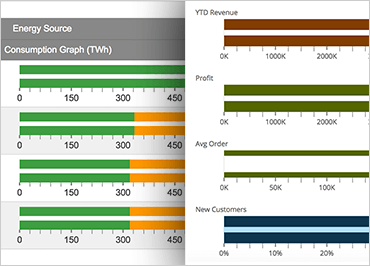
Ignite UI Bullet Graph
The Ignite UI Bullet Graph control displays values along a continuum. This visualization allows you to display positive or negative progress towards a target.
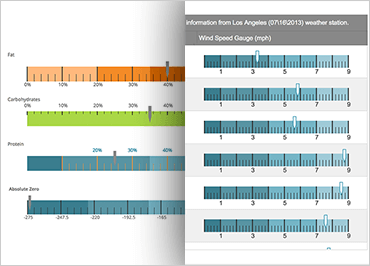
Ignite UI Linear Gauge
Ignite UI’s Linear Gauge component is a great option when you need to indicate where a specific data point sits on a defined range.
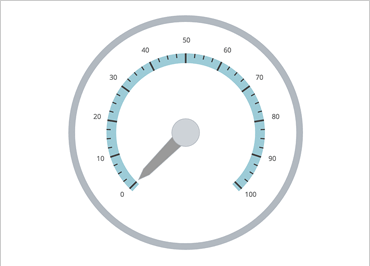
Ignite UI Radial Gauge
The Ignite UI Radial Gauge is a very intuitive way do illustrate data points along a continuum. Similar to a speedometer, the Radial Guage provides a way for you to allow your users to understand their data with a glance.