

Ignite UI Sparkline
Ignite UI for JavaScript's Sparkline control is a data-intense, design-simple visualization that allows your users to spot trends, variations, and patterns in data in a clear and compact representation. Like all Ignite UI for JavaScript data visualizations, the Sparkline component has many customization features, including markers, tooltips, and the ability to add normal range and trend lines.

Chart Types
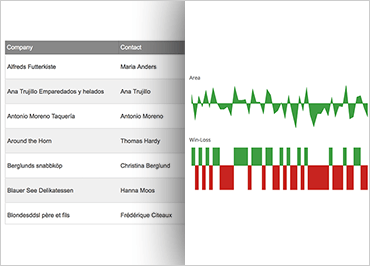
In addition to the basic line chart, Ignite UI for JavaScript's Sparkline component offers several other models for presenting data. No matter which you chose, your chart will render quickly and smoothly, even with large amounts of data.
Sparkline in a Grid
On its own, Ignite UI for JavaScript's Sparkline component is a useful, flexible way to present application data. When coupled with the Grid component, you have even more opportunities to present your data to users in intuitive and inventive ways.