
Ignite UI Charts
The most complete set of high-volume, high-performance, interactive JavaScript/HTML5 charts on the market, including support for a full range of business, scientific, and financial charting scenarios. Visualize large amounts of data, and build responsive enterprise-ready web and mobile solutions.
Key Features
- Interactive chart features, including tooltips, crosshairs, and zooming
- Remote and local data binding

Any Chart You Need
Built with performance and enterprise needs in mind, Ignite UI for JavaScript charts render large sets of data with over 75 visualization options:
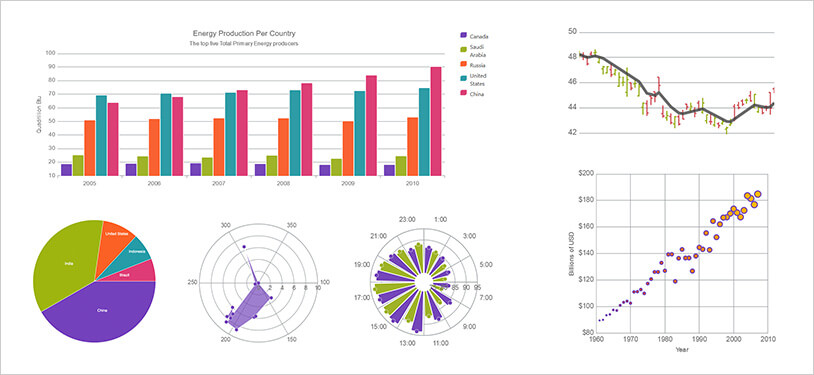
- Bar, Column, and Stacked to compare data points in one or more data series
- Scatter and Bubble to display values for two or three dimensions for a set of experiment data
- Line, Area, and Spline to display graphically quantitative data
- Waterfall to understand the collective effect of consecutively introduced positive or negative values
- Point to visualize categorized data with individual plotted point markers
- Candlestick and OHLC to visualize price movements of a security, derivative, or currency
- Polar Scatter, Line, or Spline series charts to show discrete points which are not connected and to assess the “density” of the points in a certain area
- Radial Line, Column, or Pie series chart to make quantitative comparisons between multiple aspects of one object
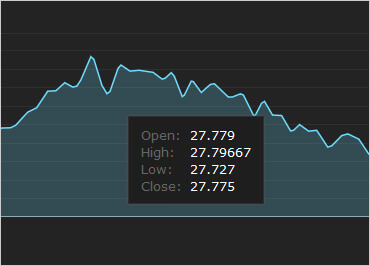
Interactive Charts
Make the most out of your financial and economic scenarios with only a few clicks with our interactive charts, providing users with features such as hover interactions, series highlighting, tooltips, and crosshair.
Highlight an entire series or individual items within the series of your report, focus on a specific part of the chart, or customize your charts to best address your business needs.
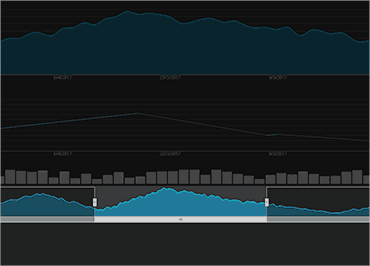
Create in-depth analysis with Ignite UI’s Zoombar
The Zoombar further enhances the capabilities of our charts and timelines and can also be plugged into other controls. It allows users to focus on the details currently important to their financial analysis or stock tracking report for example, and clearly display the data for faster and more well-informed decisions.
View Sample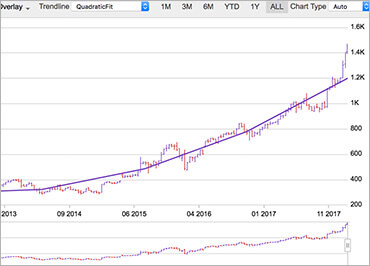
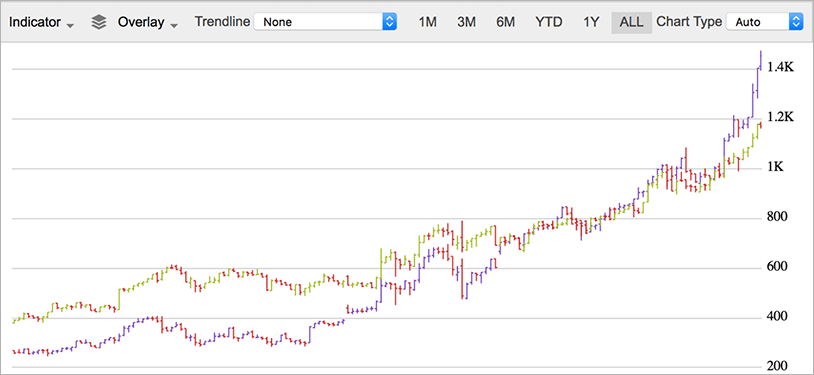
Trendlines – Calculate trends of financial data automatically
Ignite UI for JavaScript trendlines enable users to evaluate the tendencies in their data and mentally extrapolate past, future, or unknown values. Extremely useful in financial scenarios, the trendlines allow you to choose among several formulas for generating a trending directional line.
View Sample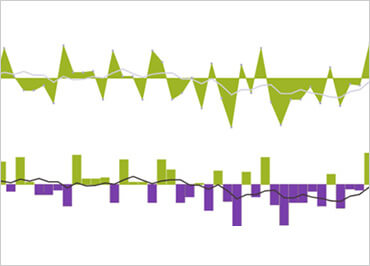
Sparkline
Ignite UI for JavaScript Sparkline chart component is a data-intense, design-simple graphic that allows end users to spot trends, variations, and patterns in data in a clear and compact representation.
View SampleFinancial Chart
Easily configure financial data with this lightweight chart for building high-performance, high-volume financial services, and capital market data applications. Just bind your data, and the chart takes care of everything else.
 View Sample
Animations
The Infragistics Motion Framework allows developers using the Ignite UI chart controls, to increase the visual appeal of, and imply trends or other meaning behind the data. Tell the story of your data in a way that allows the end users to experience a fully customizable immersive and animated user experience. End users can move step-by-step through time to see the relationship between data points change with each transition.
Customize look and feel
Customize chart axis, legend, tooltip, title in our data visualization controls in a way that best addresses your business and development needs.
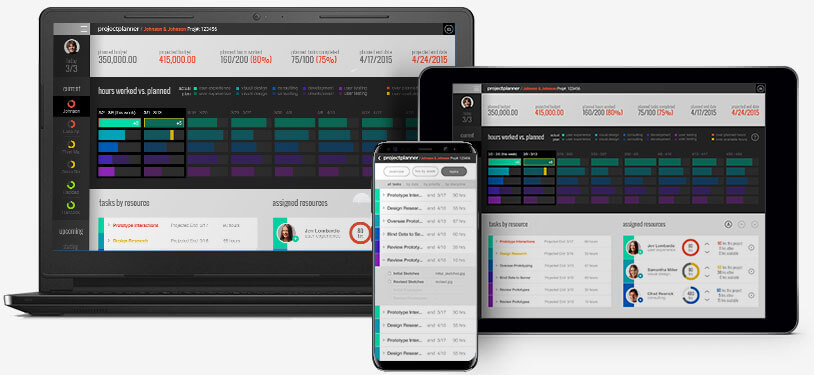
Mobile and Cross-Browser Friendly
Deliver the same experience on both mobile and desktop with consistent behavior across all browsers.
Get started today. Download a 30 day free trial with standard support included.
Download Trial