
Ignite UI Category Chart
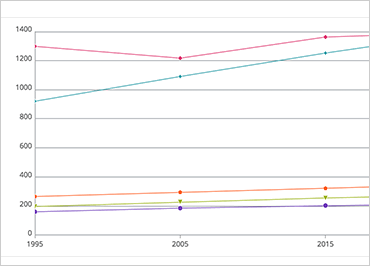
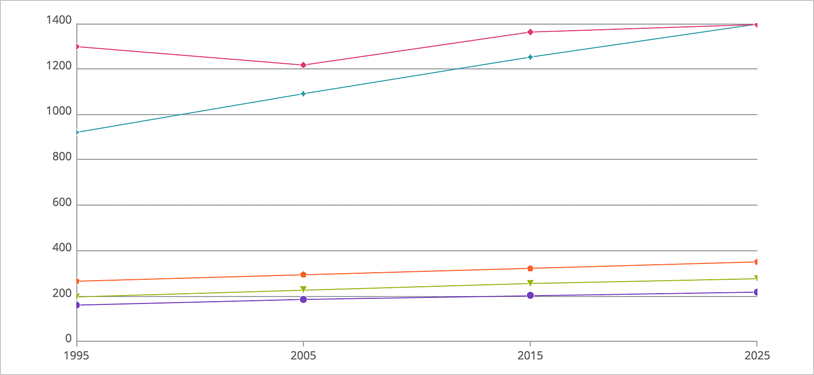
The Ignite UI for JavaScript Category Chart is an HTML5 chart component built with performance in mind. The Category Chart control is for developers who are new to charting and desire an easy way to create great charts for their web applications. It includes many great features, such as tooltips, custom marker type, and full control over chart axis formatting. The Category Chart component offers the most popular chart types: line, column, point, area, and more. These charts render lightning fast, no matter how much data is in your data set, even when consuming live real-time data.
The Ignite UI for JavaScript Category Chart offers many options for customization. If you are looking for a charting component that offers even greater control over how your data is presented, see the Ignite UI Data Chart.
View SampleReal-time Data
Data is constantly changing. While sometimes you want a snapshot of your data, other times you need to see that data live and in motion. Ignite UI for JavaScript's Category Chart component binds to real-time data sources and provides your users with a constant stream of information in an easy-to-understand visual.
 View Sample
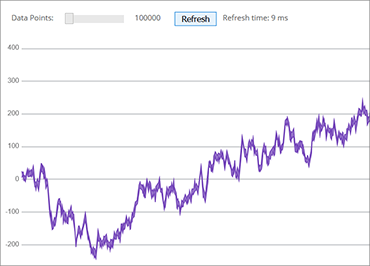
High-Volume Data
A company’s data is one of its most valuable assets. As companies recognize this, they search for ways to capitalize on the vast amounts of data at their disposal. Ignite UI for JavaScript’s Category Chart component can handle these large amounts of data easily and can quickly render your data into a great visualization.
View Sample
Callouts Layer
Annotate important data points or customize values in callout boxes based on your logic (i.e. calculate maximum values in your data source).
View Sample
Crosshair Lines
Renders a horizontal line, vertical line, or both at cursor location. Crosshair lines can snap to data points or interpolate between data points that are closest to the cursor.
View Sample
Crosshairs Annotation
Shows data point values at cursor location and renders these values in colored boxes over X and Y-axis labels.
View SampleFinal Values Annotation
Shows value of the last data point in your data source. Renders one colored box for each data source over Y-axis labels.
 View Sample
Category Highlight Layer
Renders a vertical rectangle that stretches the span of the category closest to the cursor.
 View Sample
Item Highlight Layer
Renders a semi-transparent vertical rectangle for data items in the category closest to the cursor.
View SampleTooltip Type Property
The Category tooltip layer renders a combined tooltip for all series in a data category while the Item tooltip layer renders an individual tooltip for each series in a data category.
 View Category Tooltip Layer Sample View Item Tooltip Layer Sample