

Ignite UI for jQuery Grids & Lists
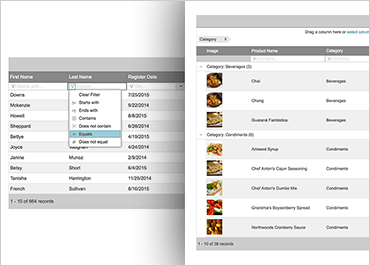
Ignite UI Data Grid
The Ignite UI for JavaScript Grid control is responsive, touch-enabled, and the fastest grid available. You can bind the grid to a variety of data sources, including JSON, XML, HTML tables, .NET collections, and even .NET data tables.
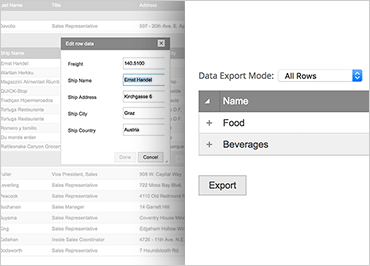
Ignite UI Hierarchical Grid
Help your users understand and work with hierarchical data, even in a mobile touch-first environment with Ignite UI for JavaScript’s Hierarchical Grid component.

Ignite UI Pivot Data Selector
Most frameworks provide an OLAP/Pivot grid as on single monolithic component with very few options to customize how the component should appear on the page and how your users should work with them.
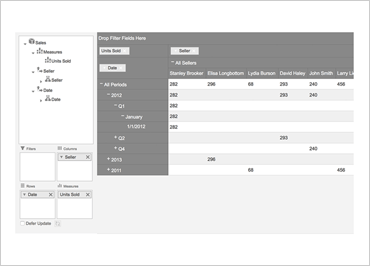
Ignite UI Pivot Grid
Most frameworks provide an OLAP/Pivot grid as one single, monolithic component with very few options to customize how the component appears on the page and how your users should work with the grid.

Ignite UI Pivot View
Users love to manipulate data, and providing them to ability to transform and shape their data to their immediate needs can provide a lot of value to your application.
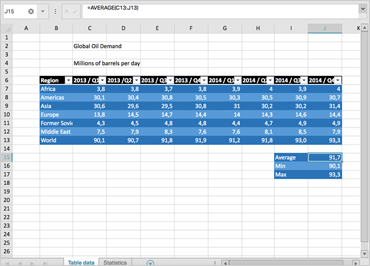
Ignite UI Spreadsheet
The Spreadsheet component provides users with a powerful yet familiar way to manage data. The Spreadsheet component is supported by the Infragistics JavaScript Excel library, enabling it to import and export data to and from Microsoft…
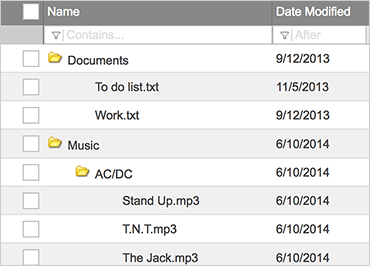
Ignite UI Tree Grid
Ignite UI for JavaScript’s Tree View Grid displays your data in a tree-like tabular structure, but has all the features you would expect from a grid control, such as filtering, sorting, and paging.
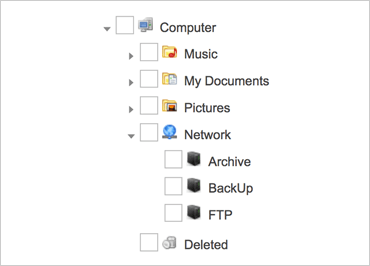
Ignite UI Tree List
Some hierarchical data is best visualized based on its relationship to data in context. The Ignite UI for JavaScript Tree component gives you ultimate flexibility in being able to provide your users with a simple UI to traverse…